
Desktop app
A small desktop GUI over the same engine as the CLI. It’s a Wails
app — a single native binary (macOS .app, Linux, Windows) with the web
frontend embedded — that reuses internal/engine: the checks, the
worst-first sort and the findings are identical to checkfleet check all. The
CLI stays the source of truth; the GUI is just another frontend.
The desktop app is beta and versioned separately from the CLI. It is not covered by the CLI’s compatibility promise: its views, bindings and stored preferences can change in any release. Two concrete gaps behind that label — the macOS build is not code-signed or notarized, so Gatekeeper will warn on first launch, and there is no menu-bar/tray icon (Wails v2 has no systray; it arrives with the v3 port). Everything the CLI guarantees, the CLI guarantees — if you need stability, script the CLI.
Views, command palette & shortcuts
The titlebar switches between three views:
- Fleet — the run summary and findings table (below).
- Dashboard — charts over the persisted history (see Dashboard).
- Config — the YAML editor for the selected file (see Edit the config).
The command palette (⌘K / Ctrl-K) is a searchable list of every action —
Run, Go to Fleet / Dashboard / Config, Focus filter, Validate, Show trend,
Export as Markdown / JSON / HTML, Toggle theme — navigable with the arrow keys
and Enter.
Keyboard shortcuts
| Key | Action |
|---|---|
⌘K / Ctrl-K |
Open the command palette |
⌘↵ / Ctrl-↵ |
Run the checks |
1 / 2 / 3 |
Switch to Fleet / Dashboard / Config |
/ |
Focus the filter box |
r |
Run the checks |
Esc |
Close the palette or any open drawer |
Long actions (a run, a history read) show a thin progress bar under the
toolbar and a spinner on Run; the outcome of an action (exported, config
saved, validated) pops a non-blocking toast in the corner. Empty and error
states are explicit — a first run shows a loading state, a config that can’t run
shows an inline error card with Retry and Open config editor. The whole
app respects prefers-reduced-motion and is keyboard-navigable (focus rings,
focus-trapped dialogs, ARIA roles).
The fleet view
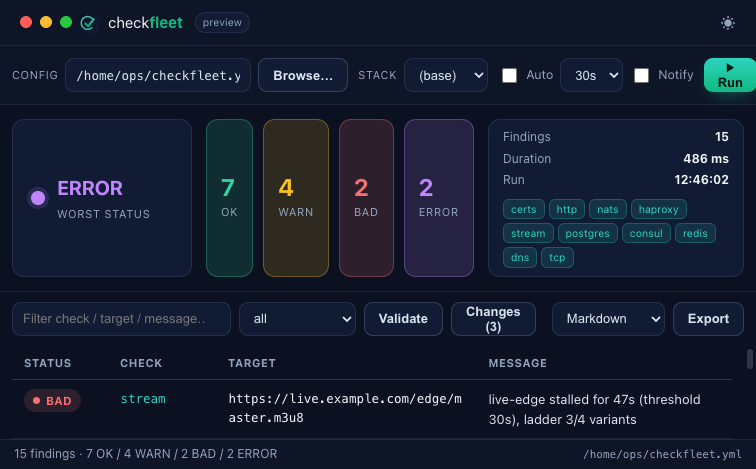
Everything is one screen, scanned top-to-bottom.
Toolbar
- Config — the
checkfleet.ymlto run. Type a path or Browse… for a native file picker. - Stack — pick a
checkfleet.<stack>.ymlprofile discovered next to the config (same overlay as the CLI’s--stack);(base)runs the base file. - Auto + interval — start a background monitor (see below) on a timer (10s / 30s / 60s / 5m).
- Notify — pop a native OS notification after a manual run whose worst status is BAD/ERROR. (The background monitor has its own change-only notifications, described below.)
- Run — execute every configured module now.
The app remembers your config path, stack, interval, Auto and Notify between launches.
Summary
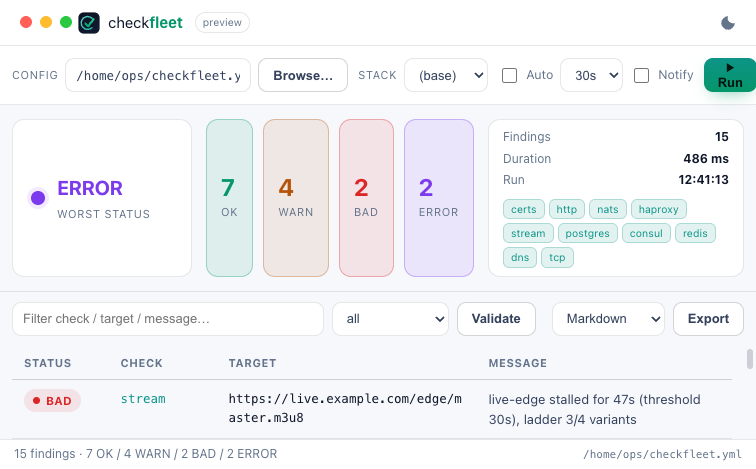
- The worst status pill (OK / WARN / BAD / ERROR) — the one thing to read first.
- Count tiles for OK / WARN / BAD / ERROR.
- Total findings, run duration, run time, and a chip per configured module.
Findings table
- One row per finding, worst-first (same order as the CLI), with a colored
status badge and the
Status / Check / Target / Trend / Messagecolumns. - The Trend column draws a tiny inline sparkline of that target’s numeric metric (latency, days-to-expiry, lag…) from the history, for the checks that measure one.
- Filter box — live substring match over check, target and message.
- Severity dropdown — show all, or only
≥ WARN,≥ BAD,ERROR.
Export
- Export — pick a format (Markdown, JSON, HTML, JUnit, Prometheus, OTLP) and
save the current run via a native save dialog. Same renderers as the CLI’s
--output.
Send to a chat or webhook
Beyond saving a file, Send… posts the current run straight to a chat or
webhook, reusing the same renderers as the CLI’s --output. Pick a target —
Slack, Discord, Teams or a generic Webhook (JSON) — and click
Send…; a toast reports whether it went.
The destination URL is never entered in the app — it comes only from an environment variable, so no secret lives in the GUI or its settings:
| Target | Env var |
|---|---|
| Slack | SLACK_WEBHOOK |
| Discord | DISCORD_WEBHOOK |
| Teams | TEAMS_WEBHOOK |
| Webhook (generic JSON) | CHECKFLEET_WEBHOOK |
If the target’s env var isn’t set, the toast tells you which one to set instead of sending anything.
Details, validate & explain
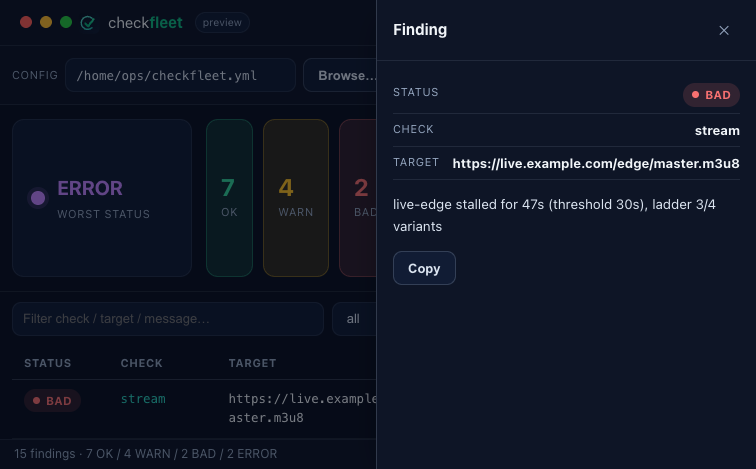
Click a finding row to open a detail drawer with the full message and a
Copy button. Click a module chip in the summary to see what that check
verifies (Explain), and the Validate button checks the config without
running anything (the same problems as checkfleet validate).
Mute a finding
Some findings you already know about — a cert you’re rotating tomorrow, a node you took down on purpose. Open the finding’s detail drawer and Snooze it for 1h, 8h, 24h, or until recovery. A muted finding dims in the table with a muted chip, and the status bar shows a running “N muted” count; Hide muted in the toolbar takes them off-screen entirely.
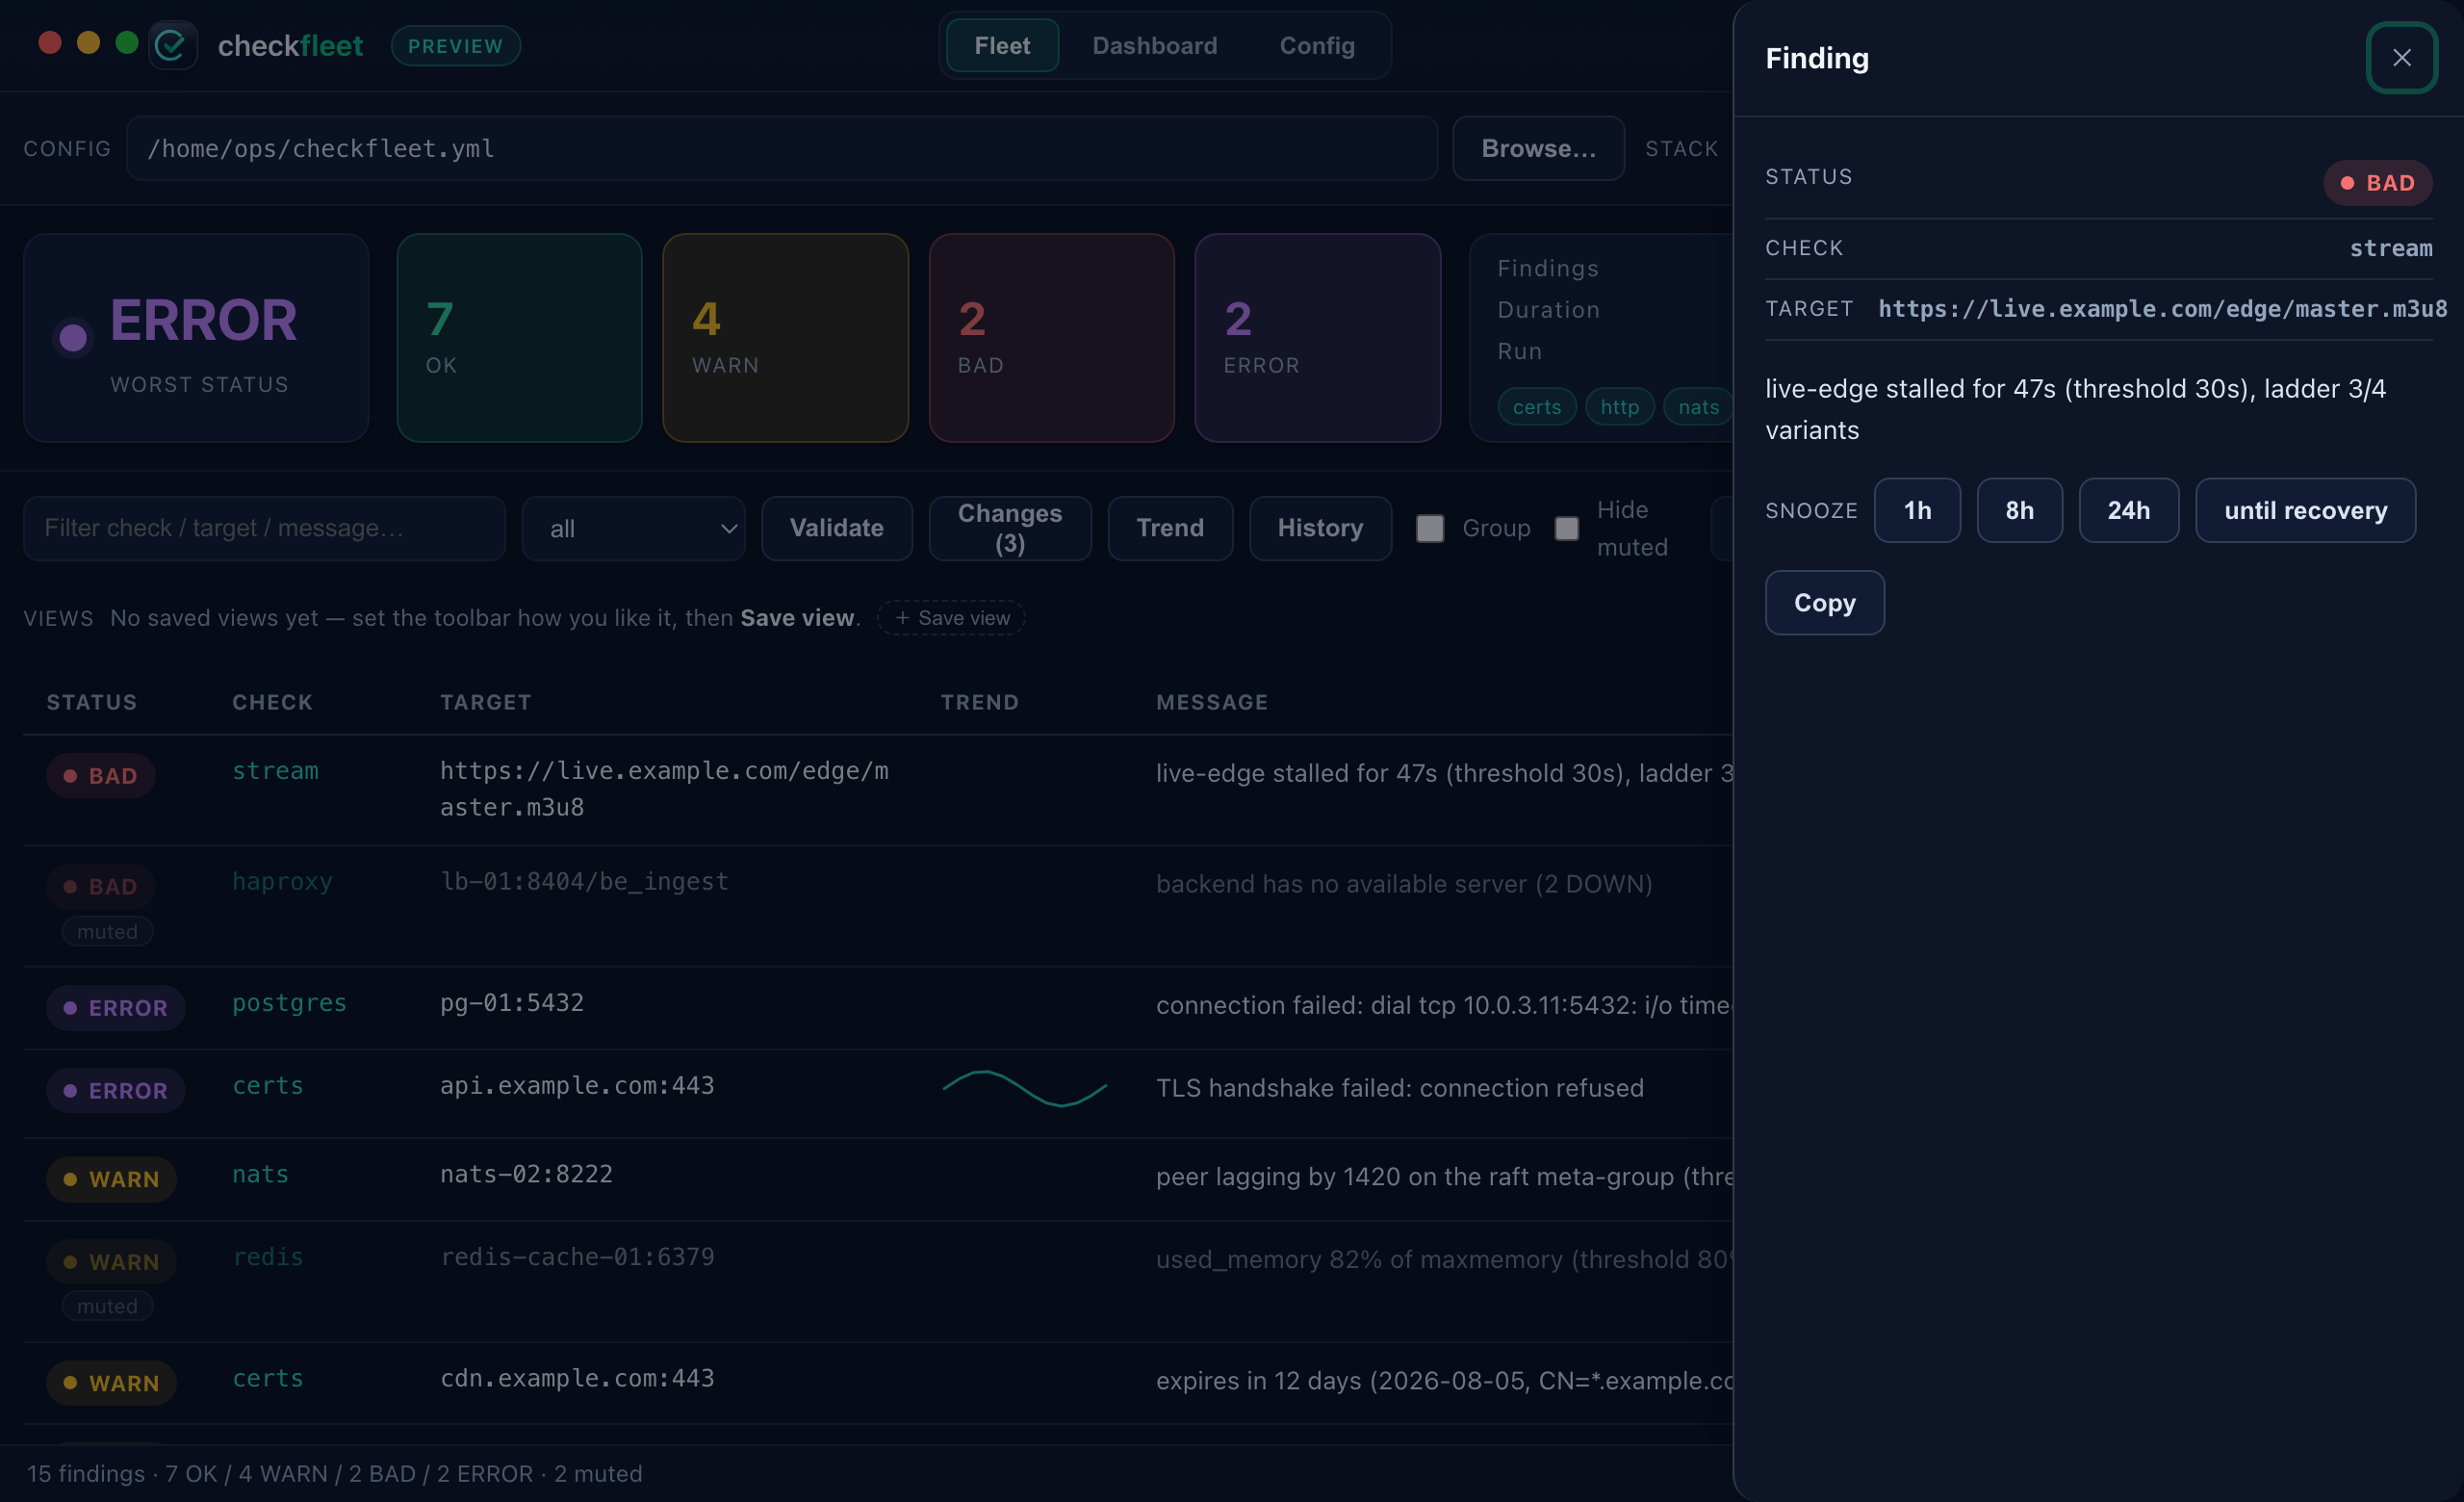
Mutes are keyed by config + check + target, so they follow the exact target across runs and don’t leak between fleets. Timed snoozes store an absolute expiry and are pruned on load, so a mute you set at 6pm for 1h is gone by 7pm even if you reopened the app in between; until recovery mutes are cleared automatically the moment the target goes green again. Everything is local (browser storage): a mute is an operator note, never a change to your YAML, and holds no secrets.
Muting is more than cosmetic — it feeds the headline and the monitor. The worst-status pill is computed over un-muted findings, so a fleet whose only red items are snoozed reads as its next-worst level, not ERROR:
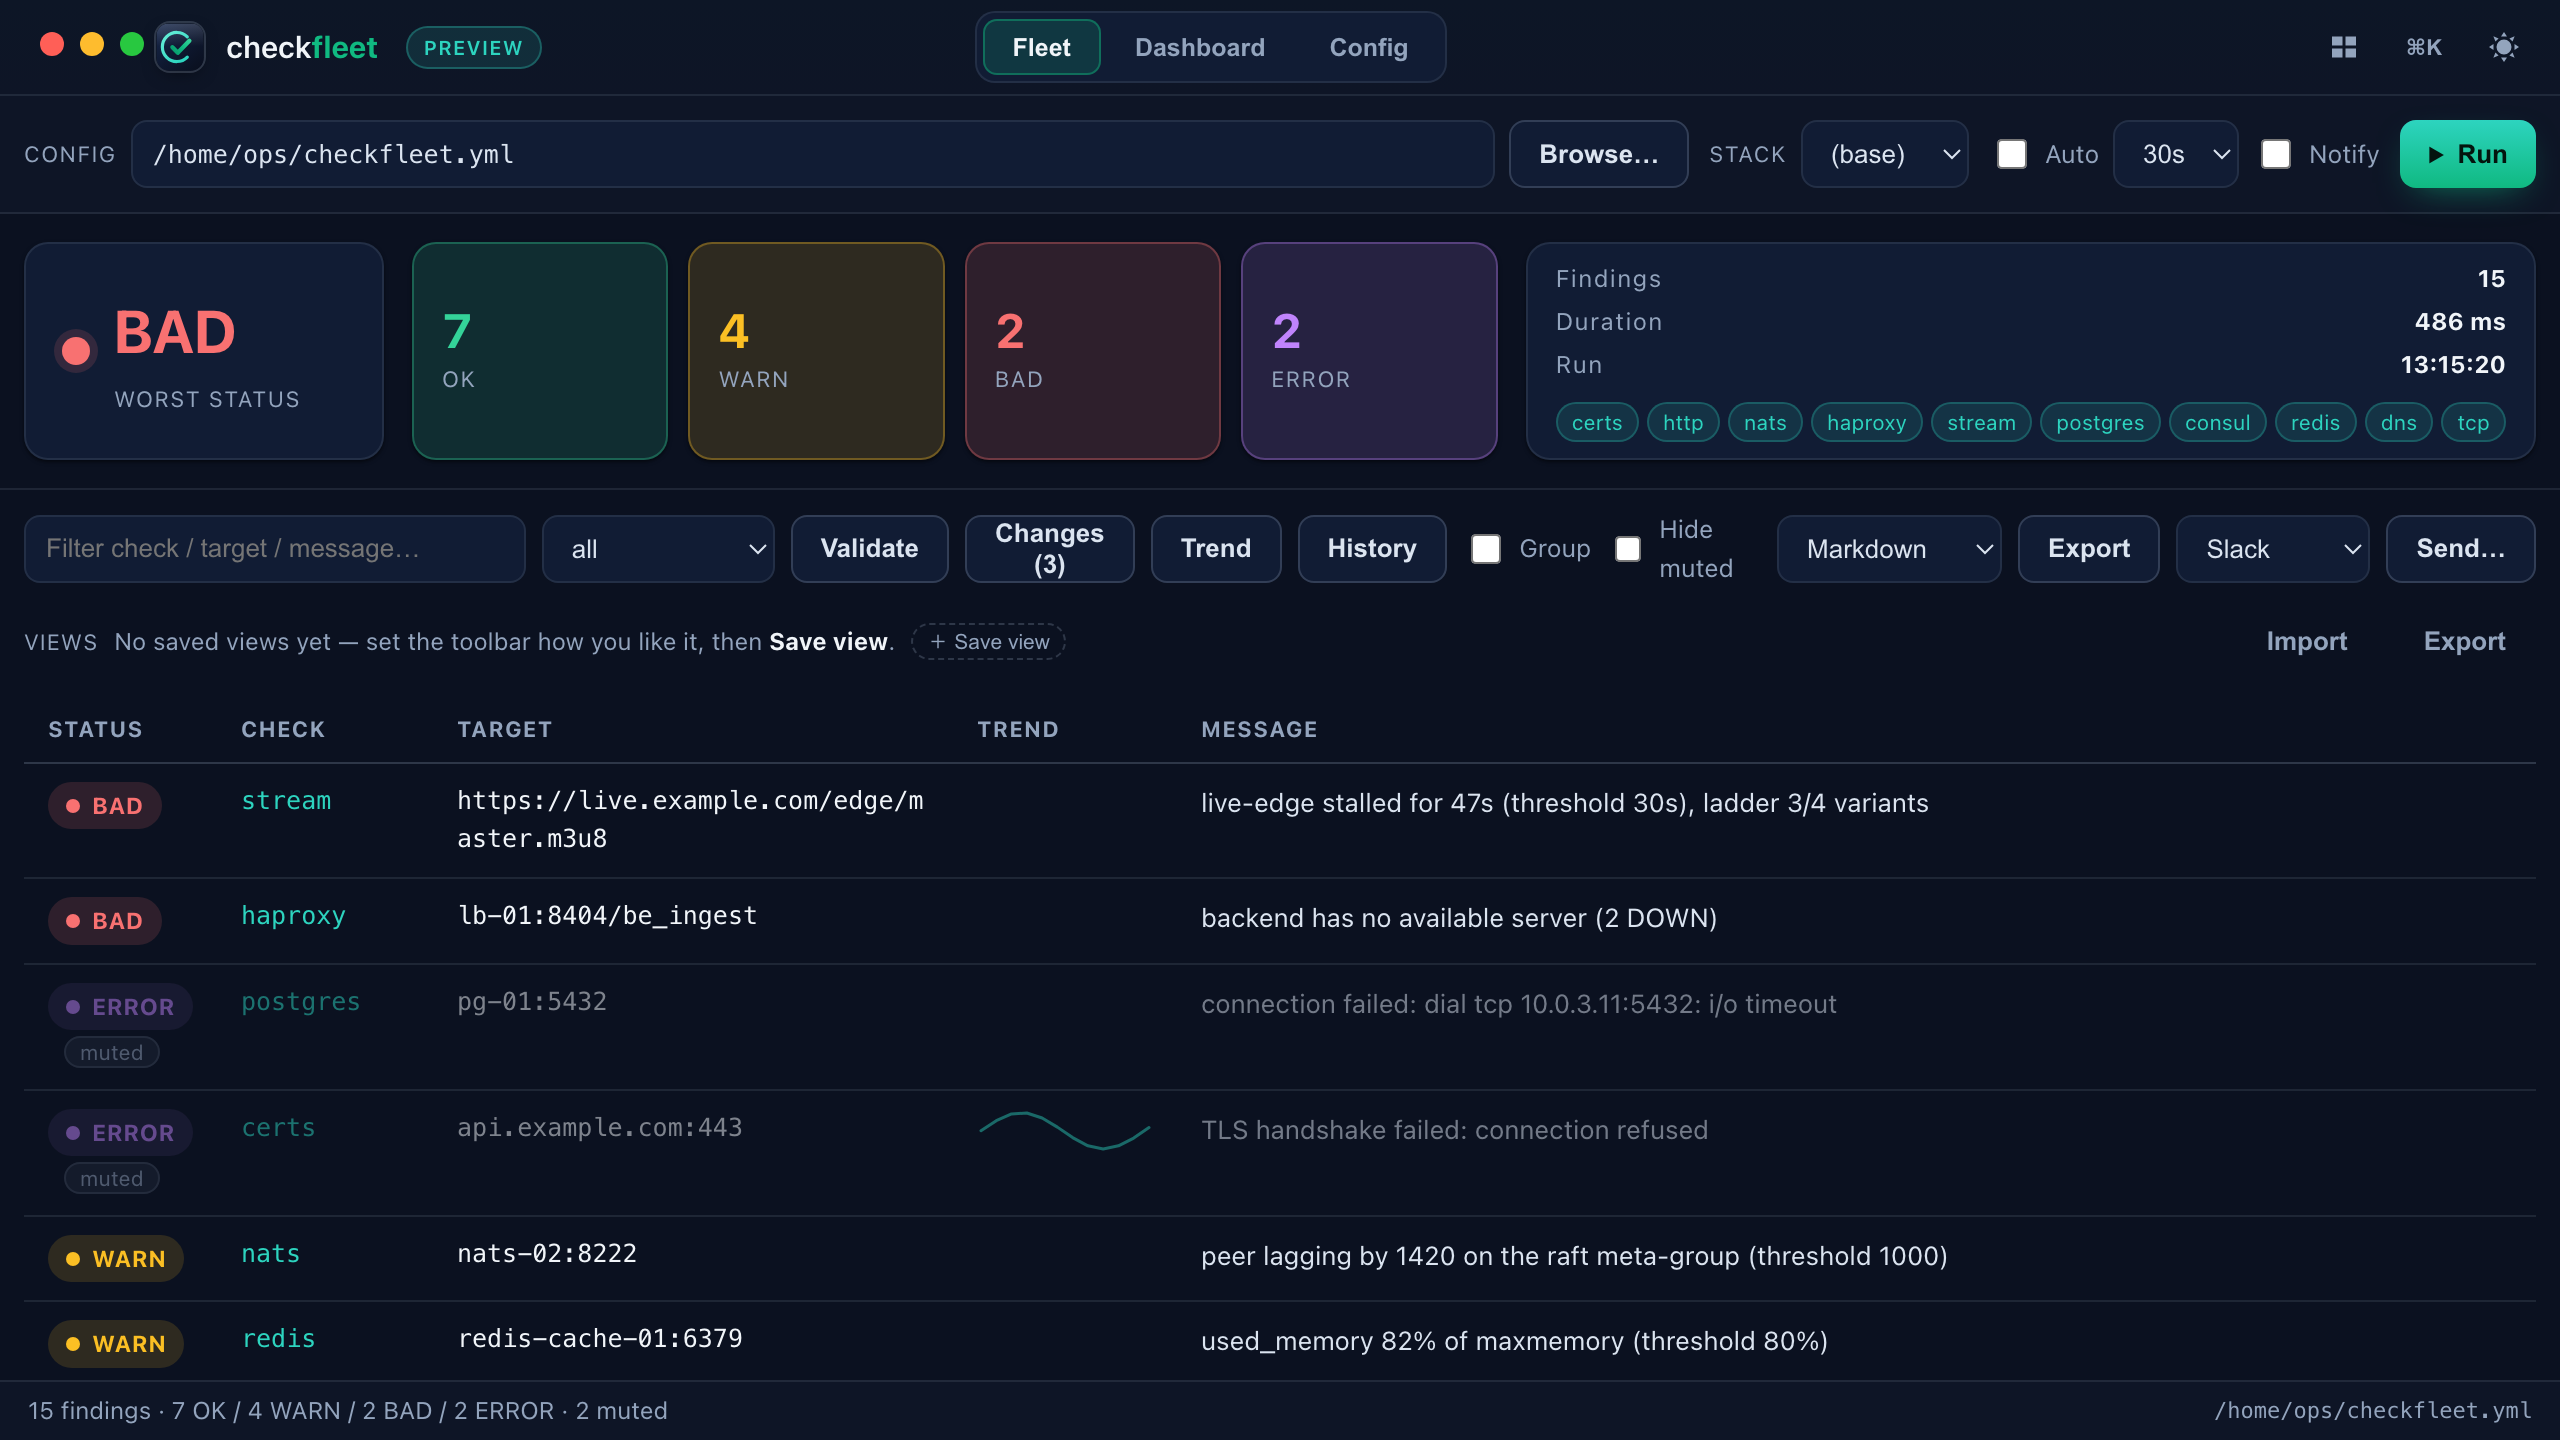
The raw count tiles stay raw (you still see 2 ERROR), and the status bar keeps the honest “N muted” tally — nothing is hidden, it just stops shouting. The background monitor uses the same mute-aware worst: a snoozed finding won’t fire a native notification or raise the ● monitoring badge until its mute lifts. (The mute set is pushed to the Go side so the off-thread monitor honours it too.)
Note a finding
Muting says “ignore this for now”; a note says why. In the finding drawer, jot an owner (optional) and a line of context — “Marco — ingest pool drained for the edge migration, expected until 18:00”. The finding then carries a note chip in the table (hover for the text), and the note comes back the next time you open it.
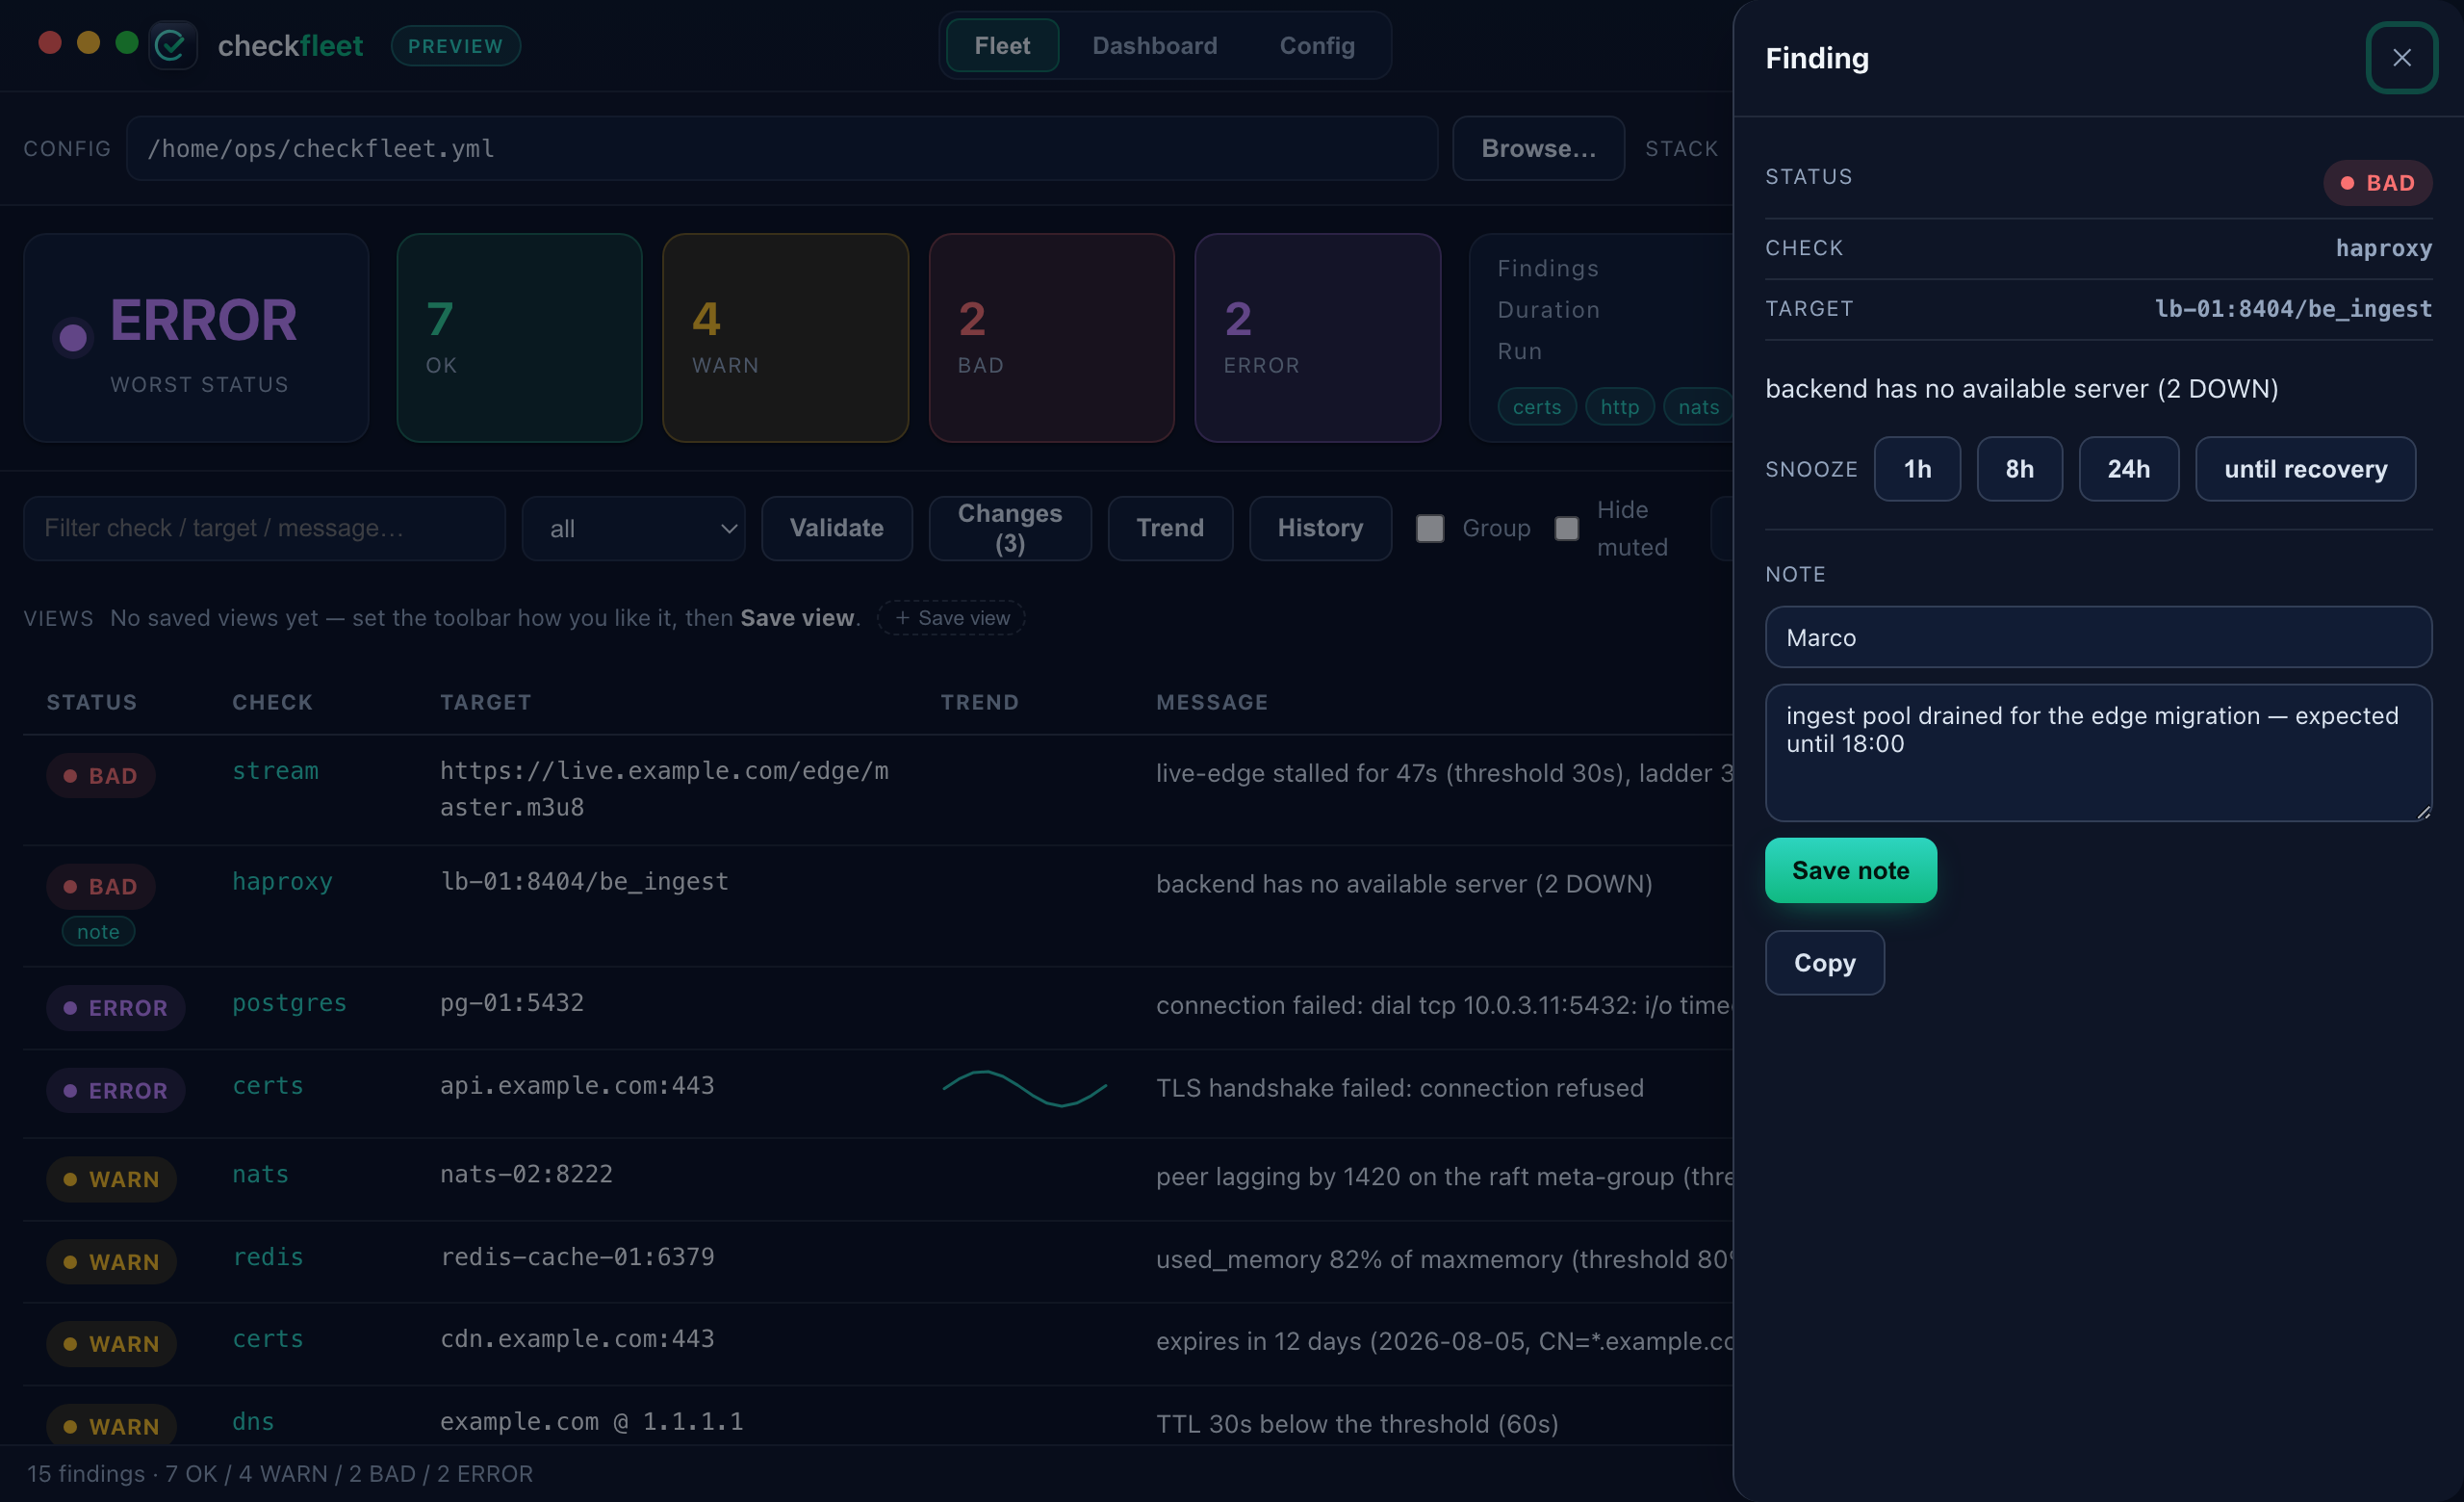
Notes share a finding’s identity with mutes (config + check + target), so a target can be both muted and annotated. Clearing both fields removes the note. Like mutes, notes are local operator context — never written to your YAML, never sent anywhere, no secrets.
Report a finding to your tracker
When a finding is a real problem you want tracked, open its drawer and
Report issue → GitHub / GitLab. checkfleet opens an issue with a
prefilled title ([checkfleet] check/target — STATUS) and body (the message and
context), then toasts a link you can Open in your browser.
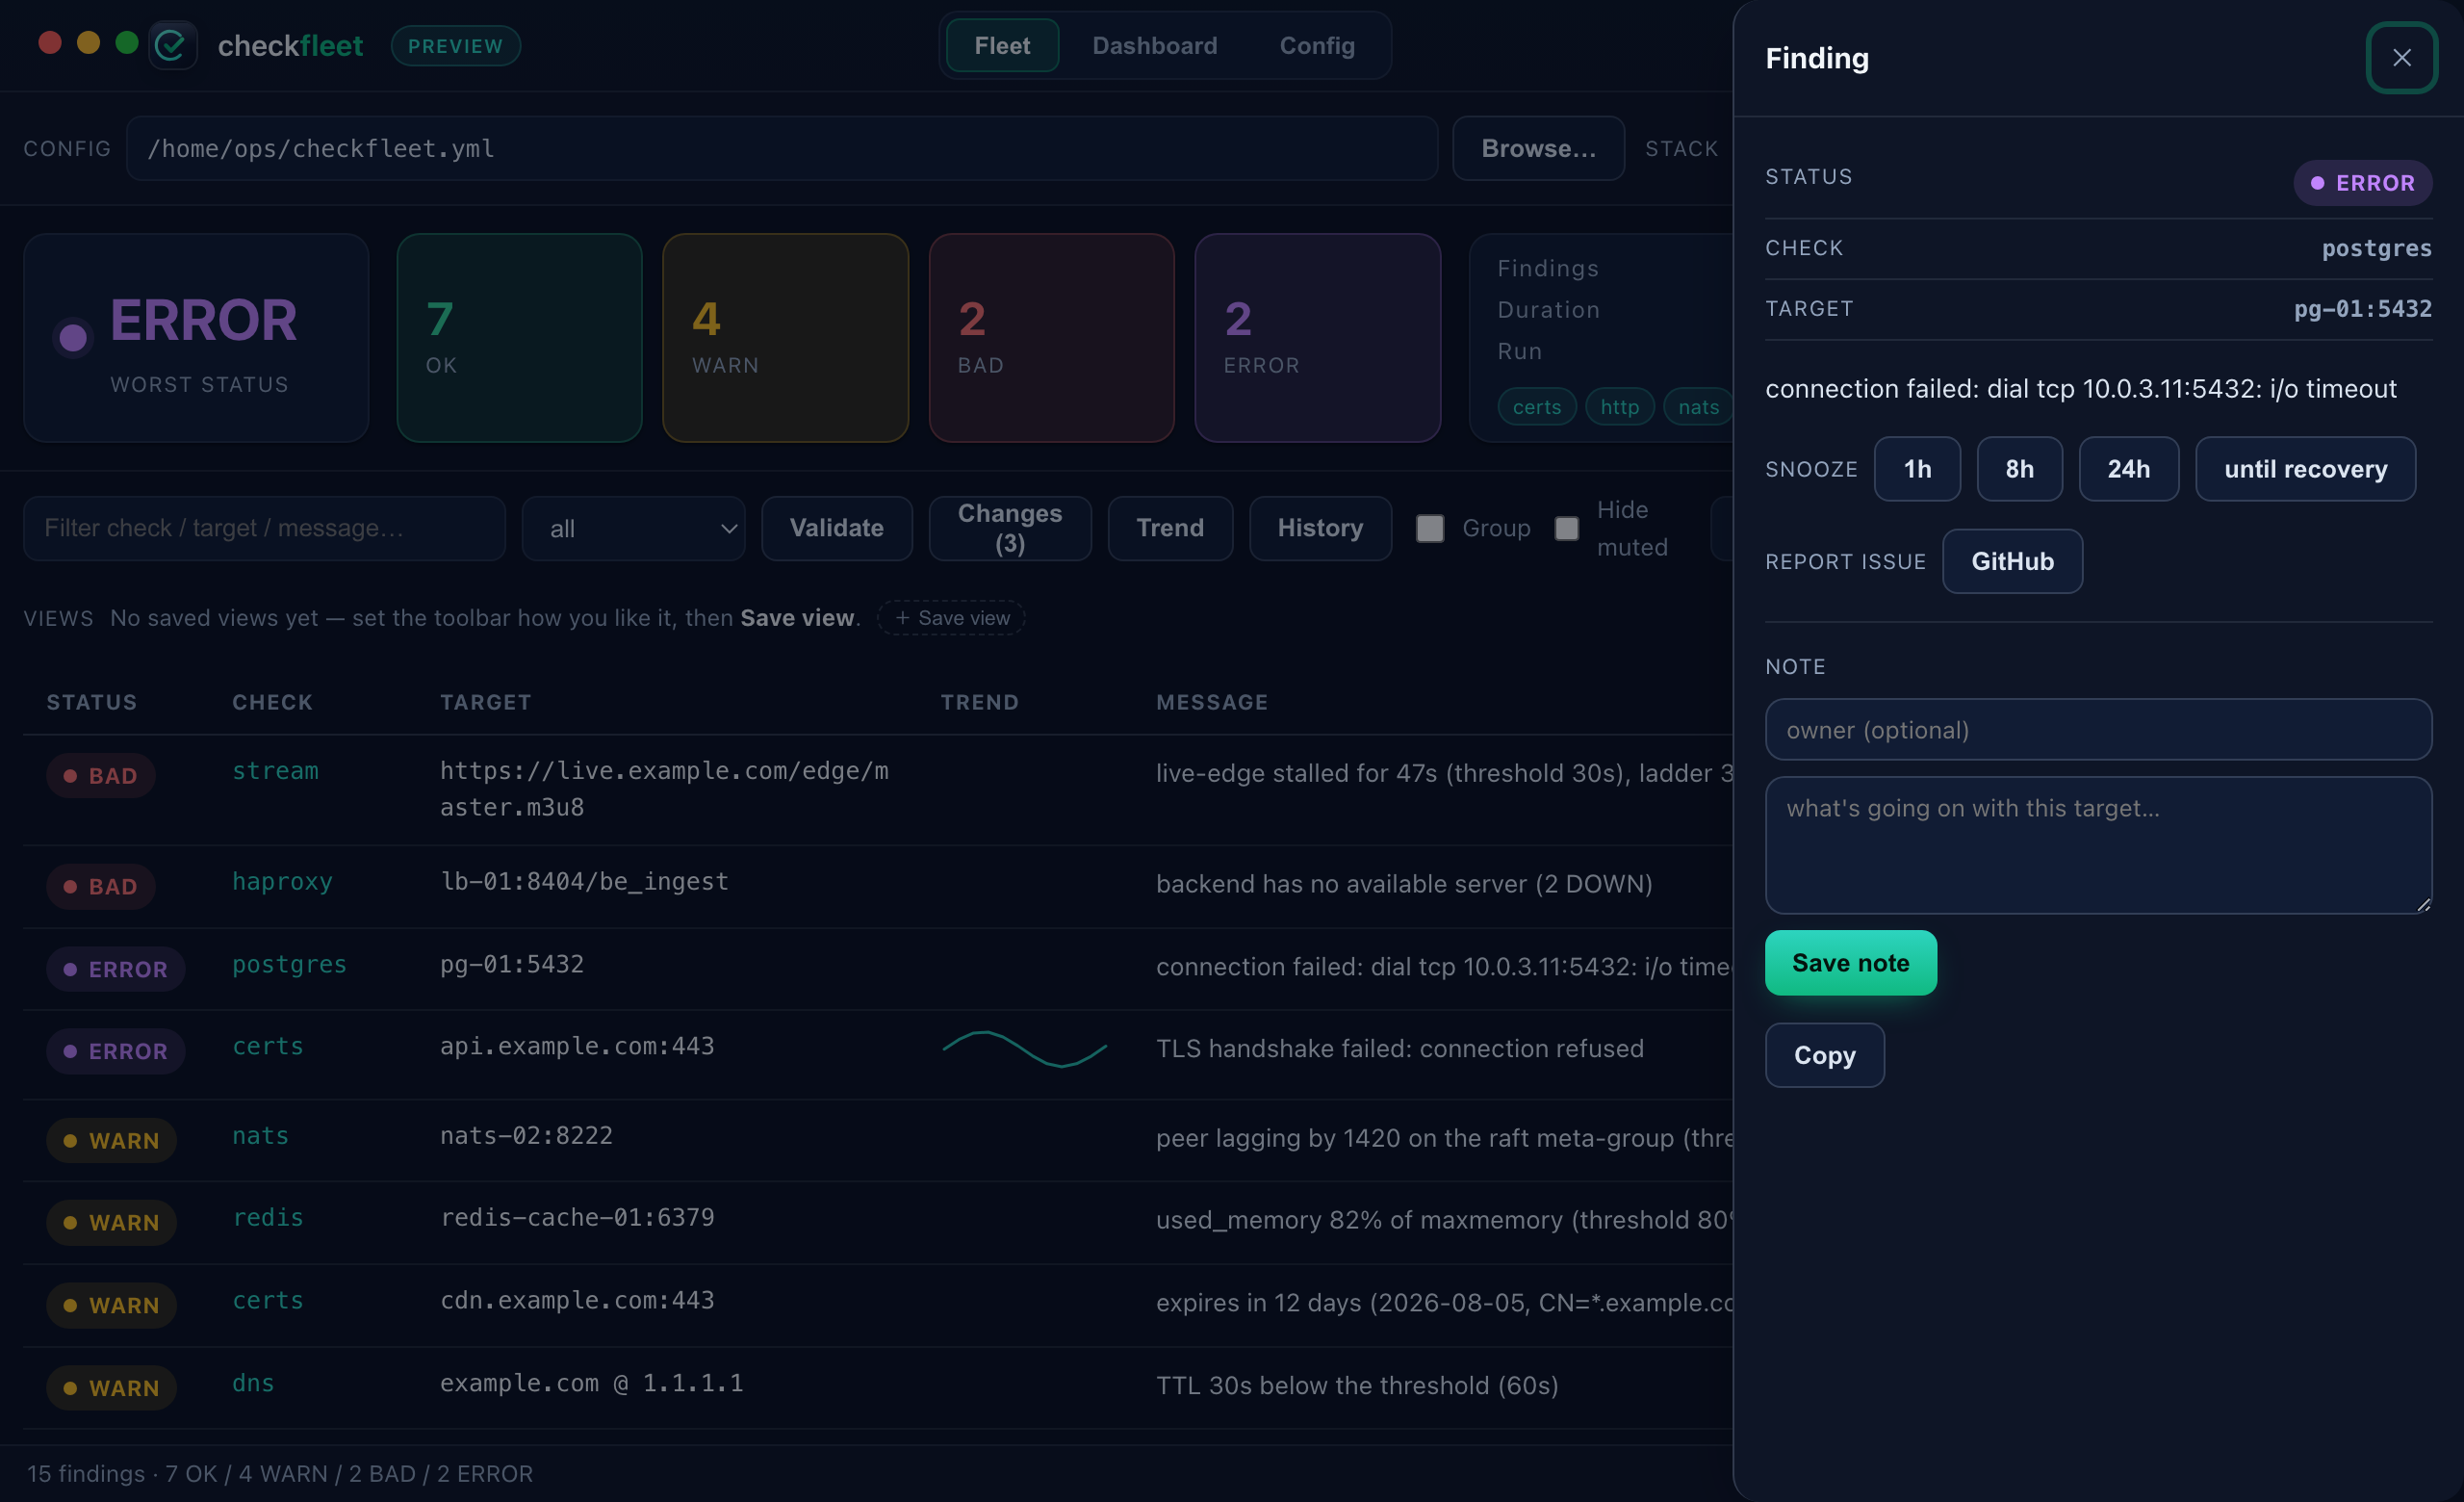
The button only appears for BAD/ERROR findings, and only for a forge that’s configured — the repo/project and token come only from environment variables, never the UI:
| Forge | Repo/project | Token | API override (optional) |
|---|---|---|---|
| GitHub | GITHUB_REPO (owner/repo) |
GITHUB_TOKEN |
GITHUB_API |
| GitLab | GITLAB_PROJECT (id or url-encoded path) |
GITLAB_TOKEN |
GITLAB_API |
This is a one-click “open an issue for this finding”; for bulk open/close
reconciliation across a whole run there’s the CLI’s
report-issues subcommand (which drives the gh/glab CLIs).
No token ever touches the app’s storage or a config file.
Action log
Every workflow action — a mute, an unmute, a note, an issue opened — drops a line in the Action log (the Actions button in the toolbar). It’s the timeline of what did we actually do about the fleet, newest first, with a UTC timestamp, the target and the detail.
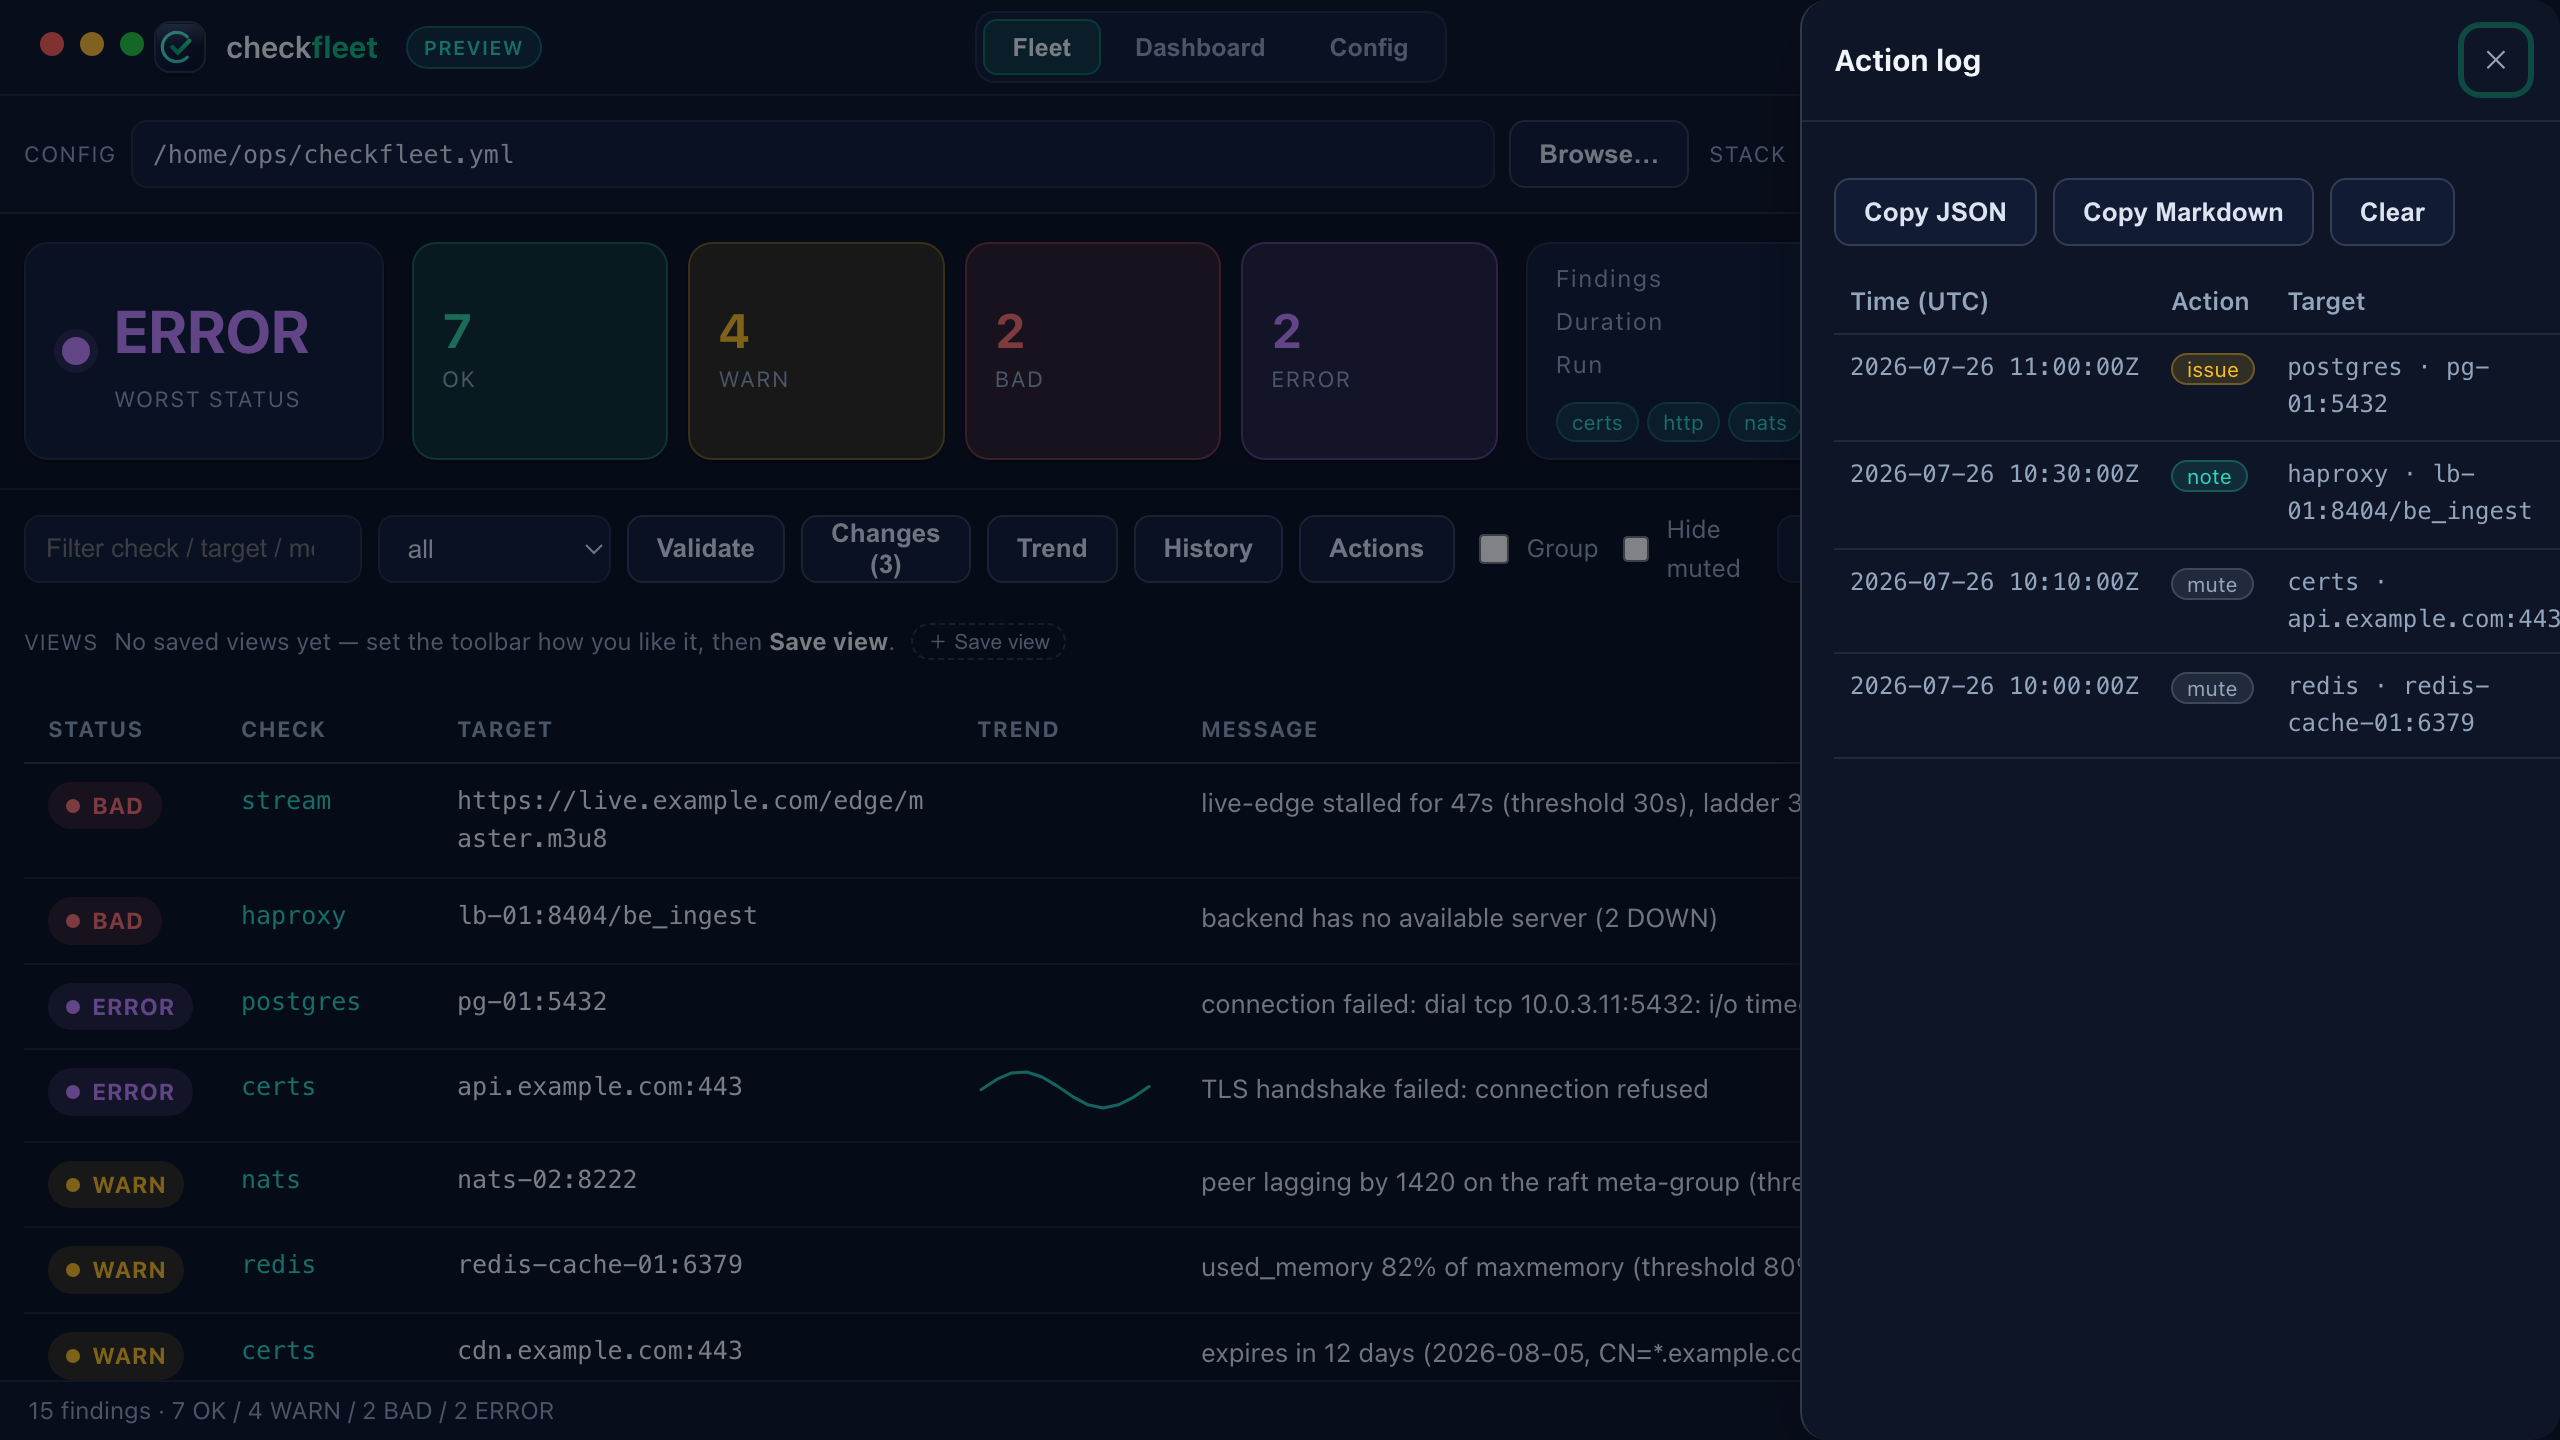
Copy JSON or Copy Markdown puts the whole log on your clipboard — the Markdown is a ready table to paste into a handover or a postmortem — and Clear empties it. The log is local and bounded (the last 200 actions); like everything in the incident workflow it holds operator history only, never secrets (an opened issue is logged by its URL, never a token).
Dashboard
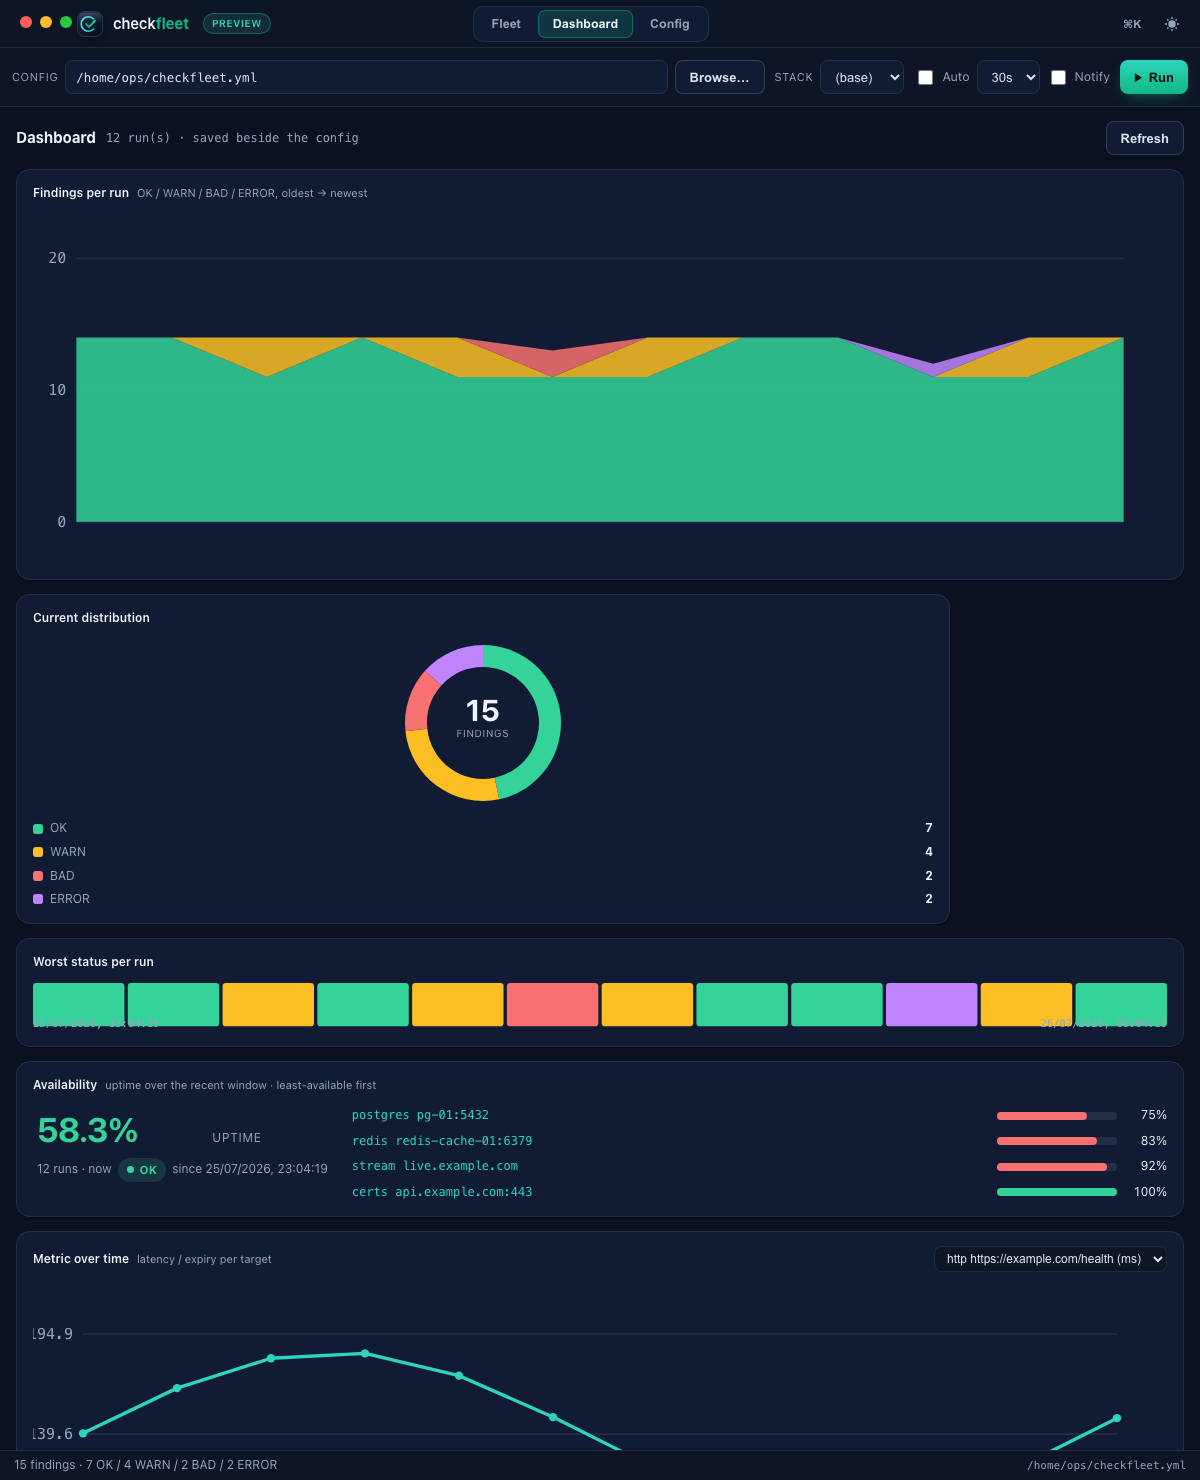
The Dashboard view charts the persisted history (each Run is appended next to the config), so you see how the fleet behaves over time rather than just now:
- Findings per run — a stacked-area timeline of the OK/WARN/BAD/ERROR counts across recent runs.
- Current distribution — a donut of the latest run’s status split.
- Worst status per run — a compact color band, oldest → newest.
- By module — a module × run heatmap, color-coded by each module’s worst status; click a row to drill into that module’s trend.
- Availability — fleet uptime (share of runs that were all-OK) over the window, how long the current status has held, and the least-available targets with an SLO meter.
- Metric over time — a line chart of a numeric metric (latency, days-to-expiry, replication lag…) for a chosen target; hover a point for the value. A metric-bearing finding’s detail drawer shows the same line inline.
Every chart is hand-drawn inline SVG — no chart library, no CDN — and follows the light/dark theme. The Dashboard refreshes after each Run.
Changes since the last run
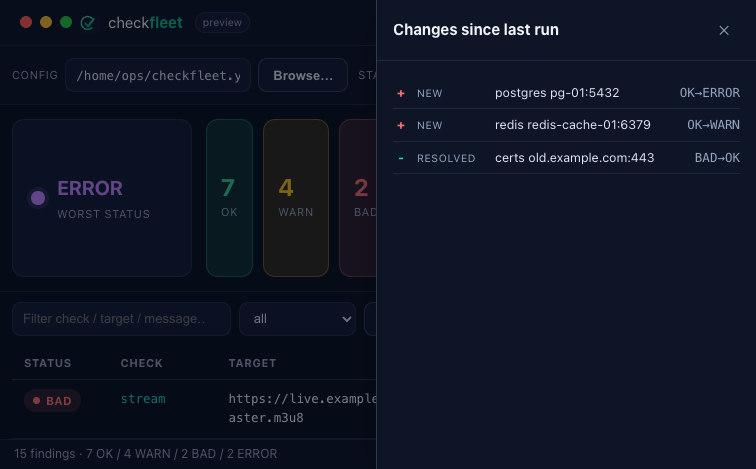
After a second run, Changes (N) opens a drawer with only what moved — new, resolved, worsened or improved findings — so you see the delta at a glance during an incident (in-session, no history file needed).
Trend over time
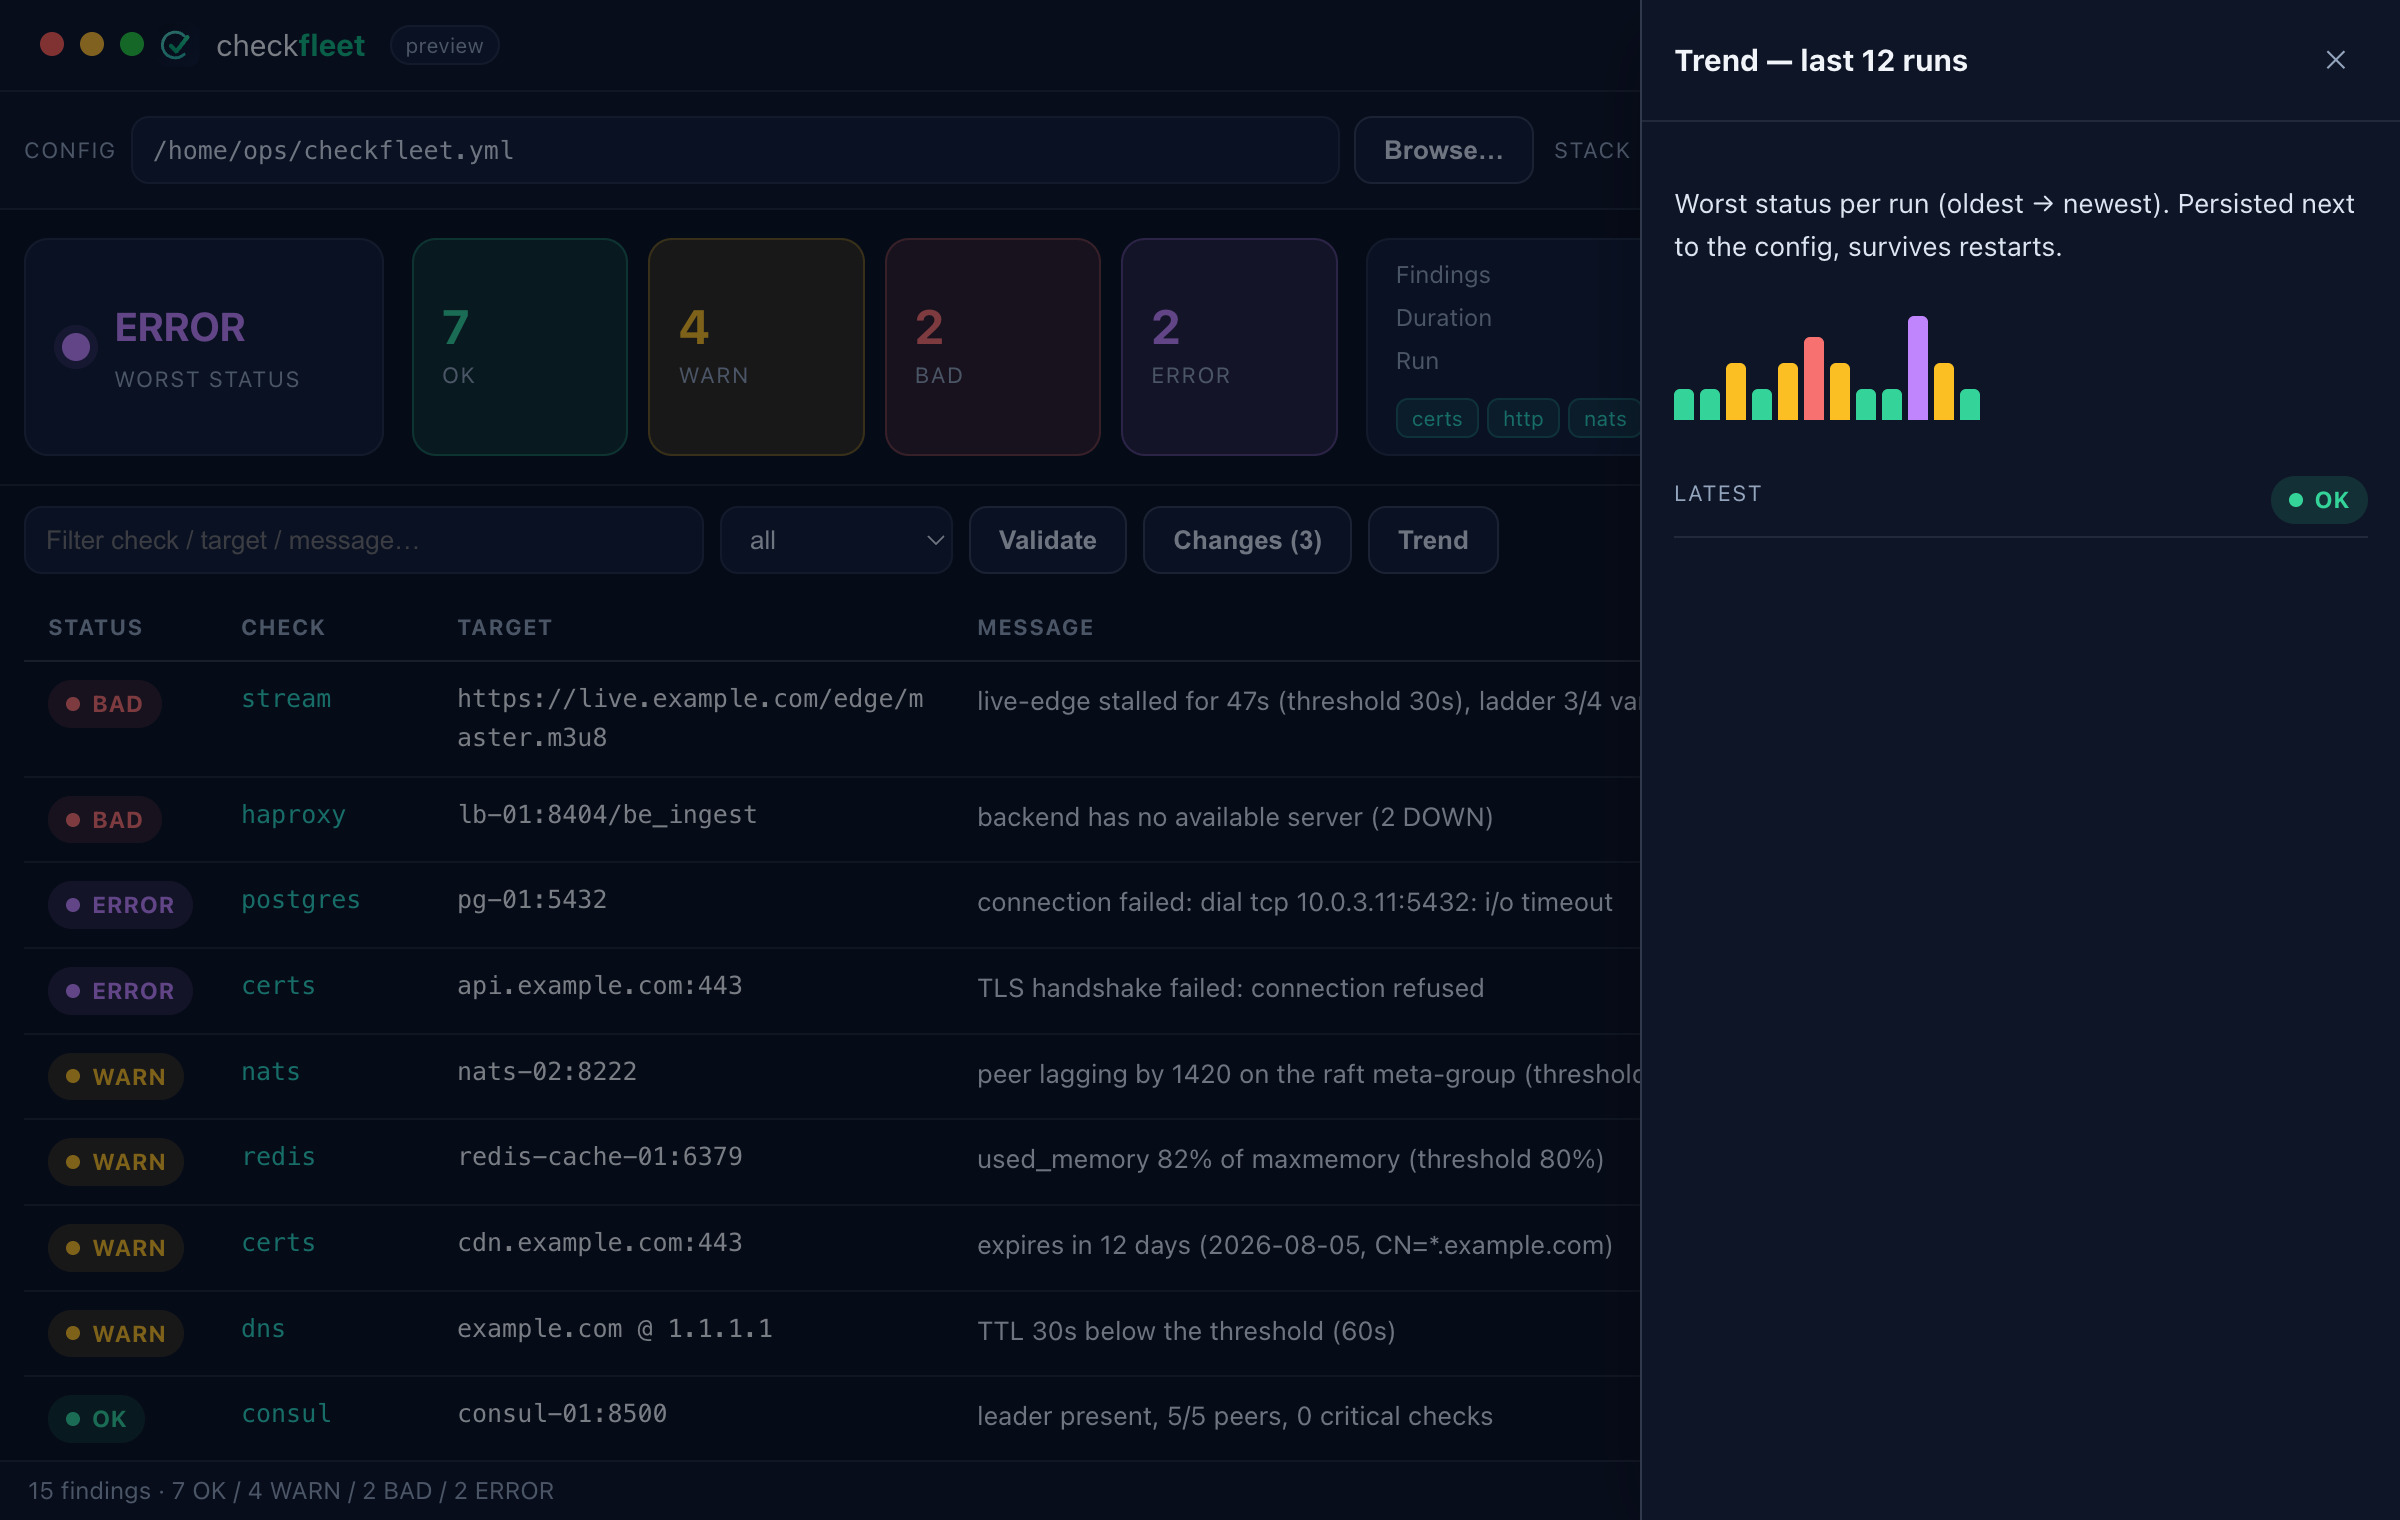
Changes is in-session only. Trend is persistent: every run is appended to
a small history file next to the config (.<name>.history.jsonl), and the button
opens a sparkline of the worst status per run — green/yellow/red/purple bars,
oldest to newest — so you can see a fleet degrade (or recover) across restarts.
Hover a bar for the timestamp and the OK/WARN/BAD/ERROR breakdown.
History browser
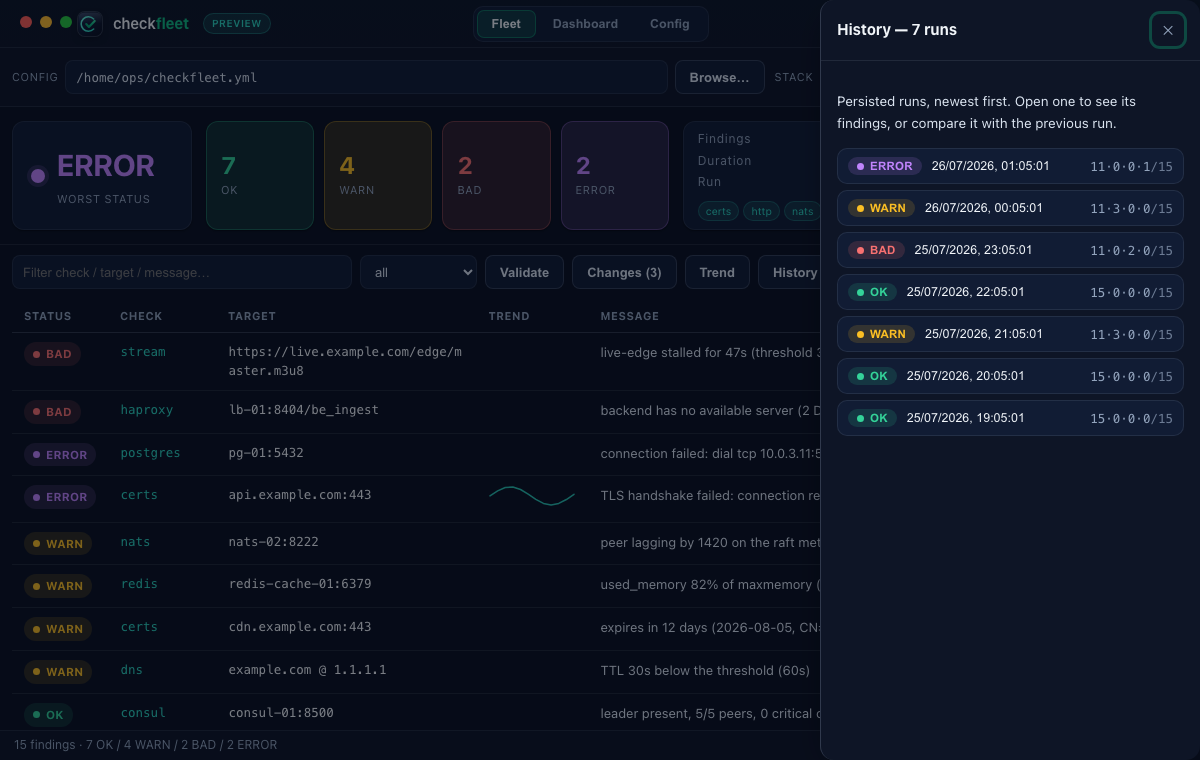
Trend shows worst-status bars; History browses the runs themselves. The button opens a drawer listing every persisted run — newest first, each with its worst-status badge, timestamp and OK/WARN/BAD/ERROR counts. Open a run to see its findings (status and numeric value — the compact history file doesn’t store messages), and Compare with previous shows exactly what changed versus the run before it (new / resolved / worsened / improved) — the same delta as Changes, but between historical runs.
Workspace — many fleets at a glance
A single machine often watches more than one fleet: production, staging, an edge
region, a lab box — each with its own checkfleet.yml. The workspace is the
left-hand panel that keeps them all in one place. Open it with the grid button in
the title bar (top-right), or press Esc to close it.
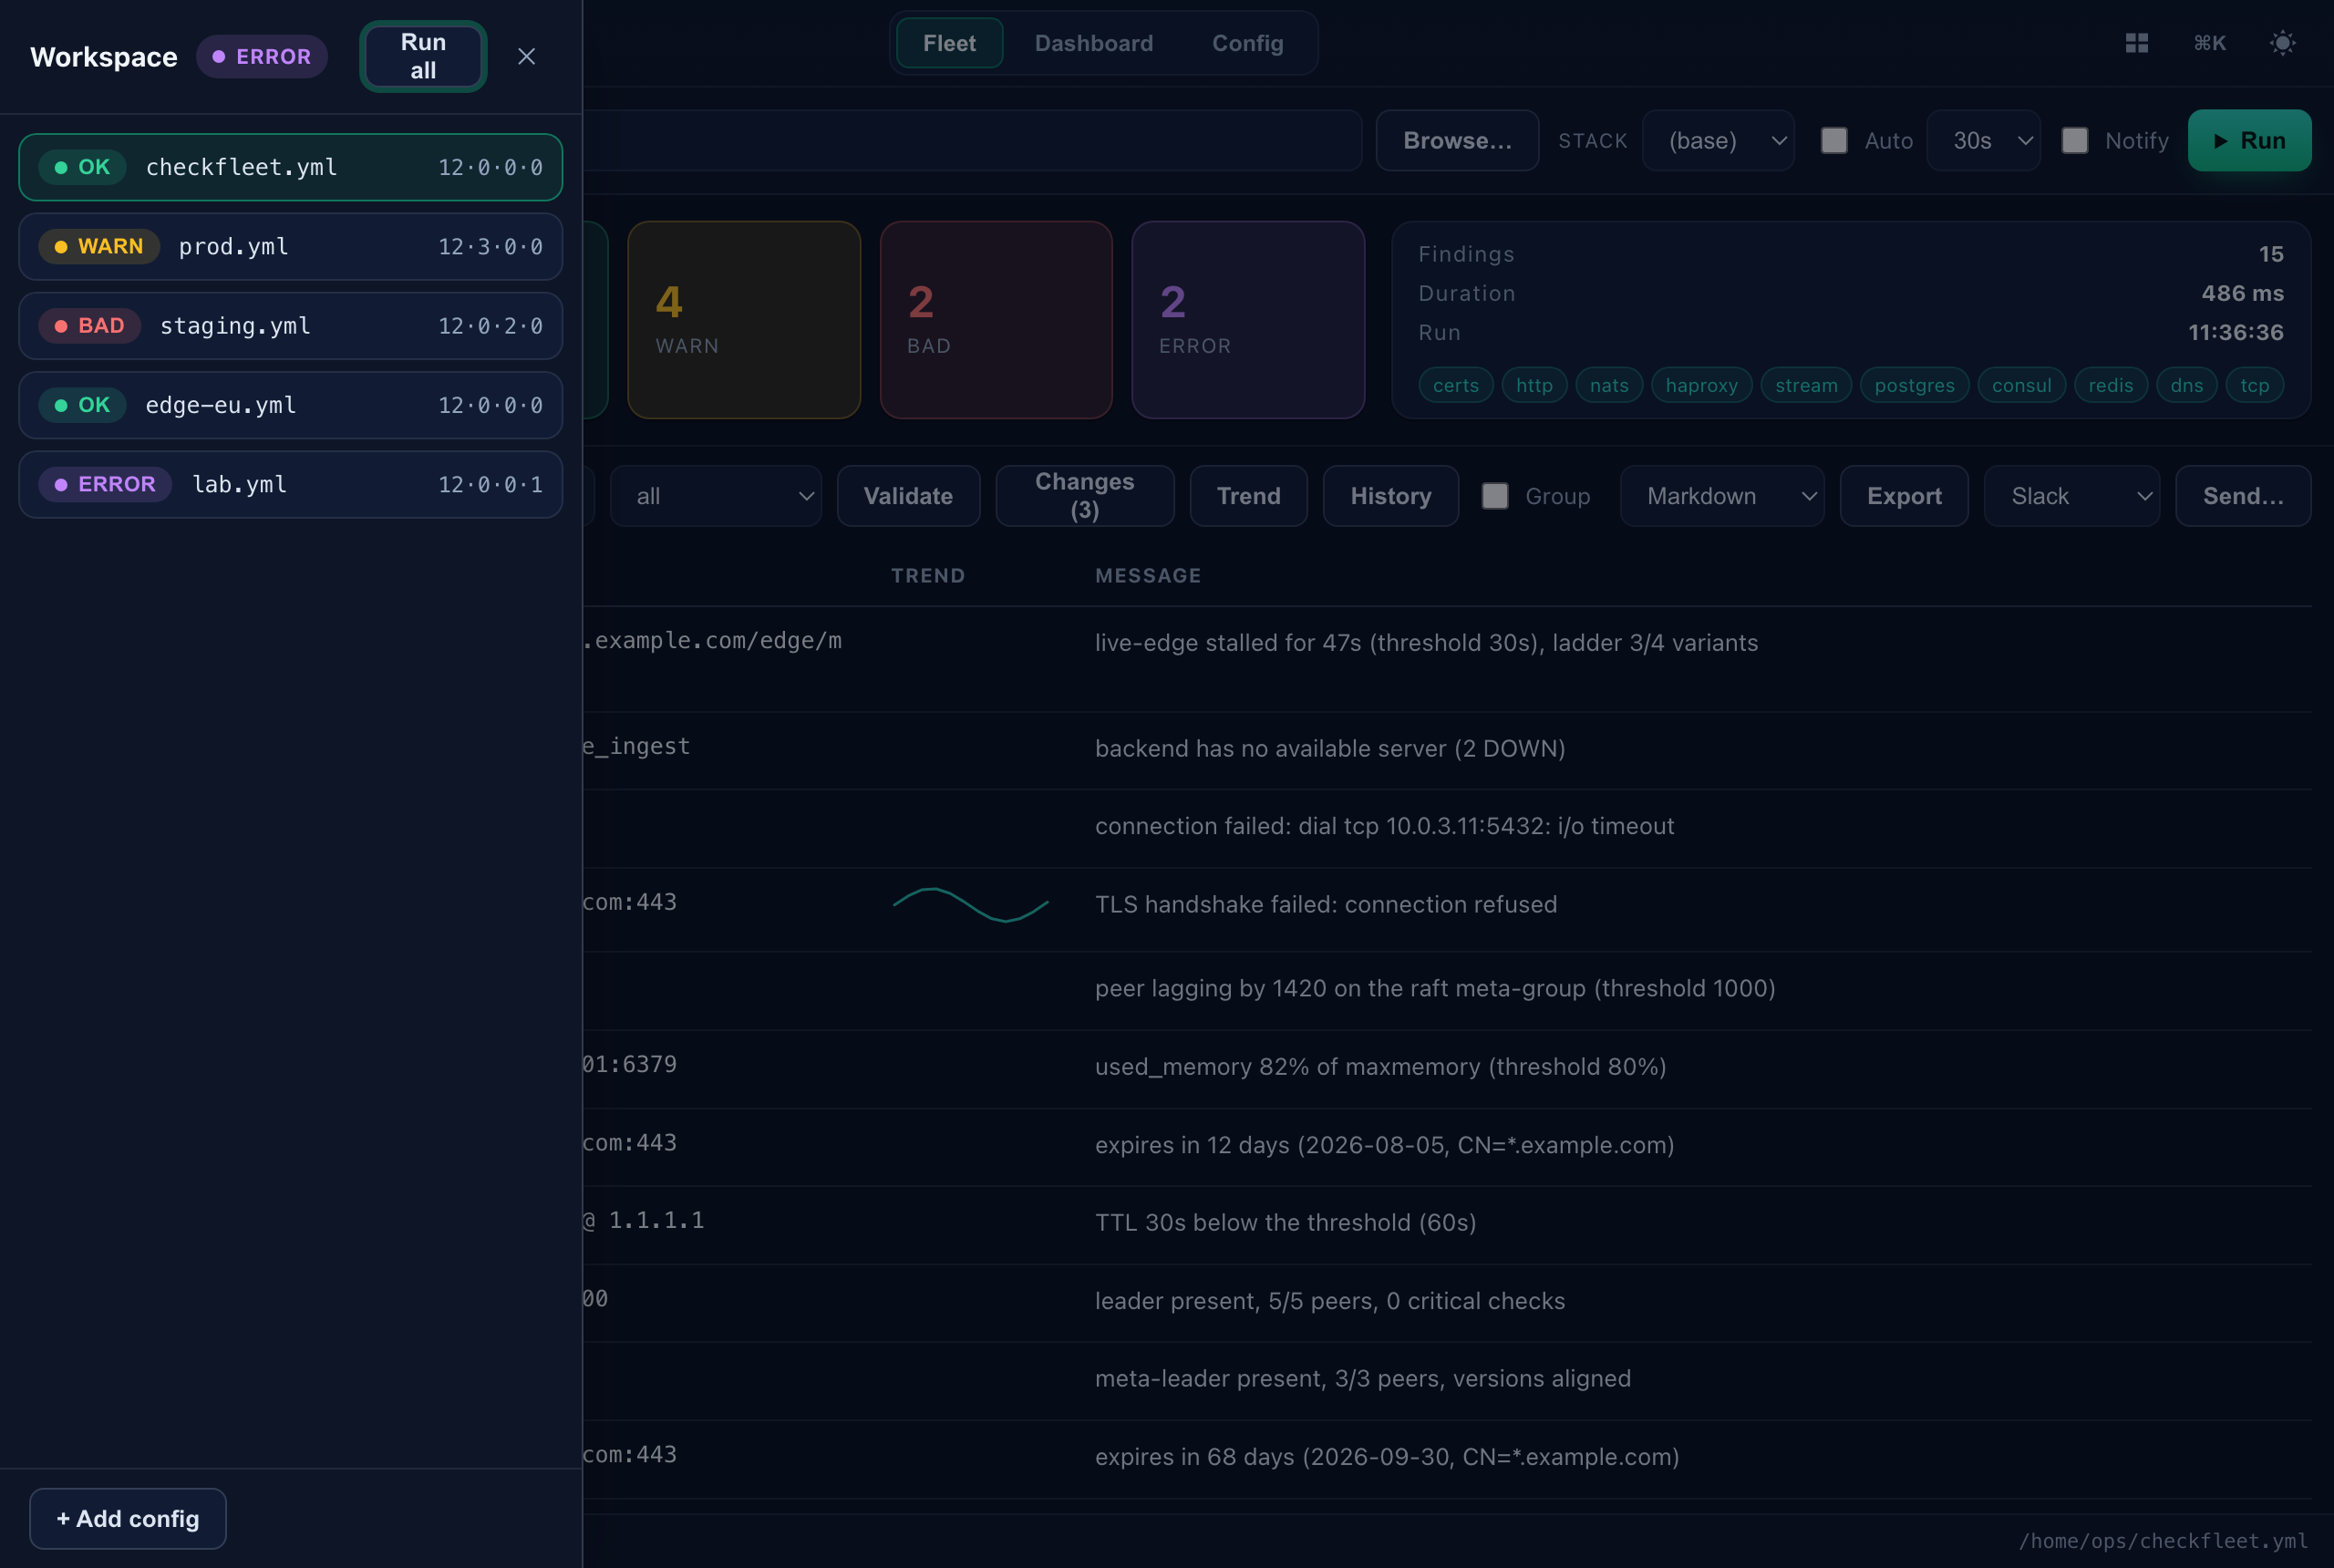
Every config you open or run is remembered here automatically — no separate “add” step needed — and you can also pin one explicitly with + Add config (it opens the same file picker as Browse…). The list holds up to 20 fleets, most-recently-used first, and survives restarts (stored in local browser storage, never on disk as a file).
Each row shows the config’s basename, and — once evaluated — its worst status as
a badge plus the OK·WARN·BAD·ERROR counts. Run all evaluates every config
in the workspace in one shot (each runs independently, with its own stack), fills
in the badges, and rolls the results up into the single worst-across-all
badge in the panel header — so you can tell at a glance whether anything,
anywhere, needs attention. Click any row to switch the main view to that fleet
(it becomes the active config and its stacks reload); the active fleet is
highlighted.
The workspace never stores credentials or config contents — only the file paths
— and evaluating a fleet here is exactly the same run as pressing Run, so
--exit-on-bad semantics and thresholds are identical.
Saved views
You keep coming back to the same handful of lenses: prod errors only, certs about to expire, everything grouped by module. A saved view captures that whole toolbar state — the stack, the filter text, the min-severity, the Group toggle and which top-level view is open — under a name, and the Views bar under the toolbar switches between them in one click.
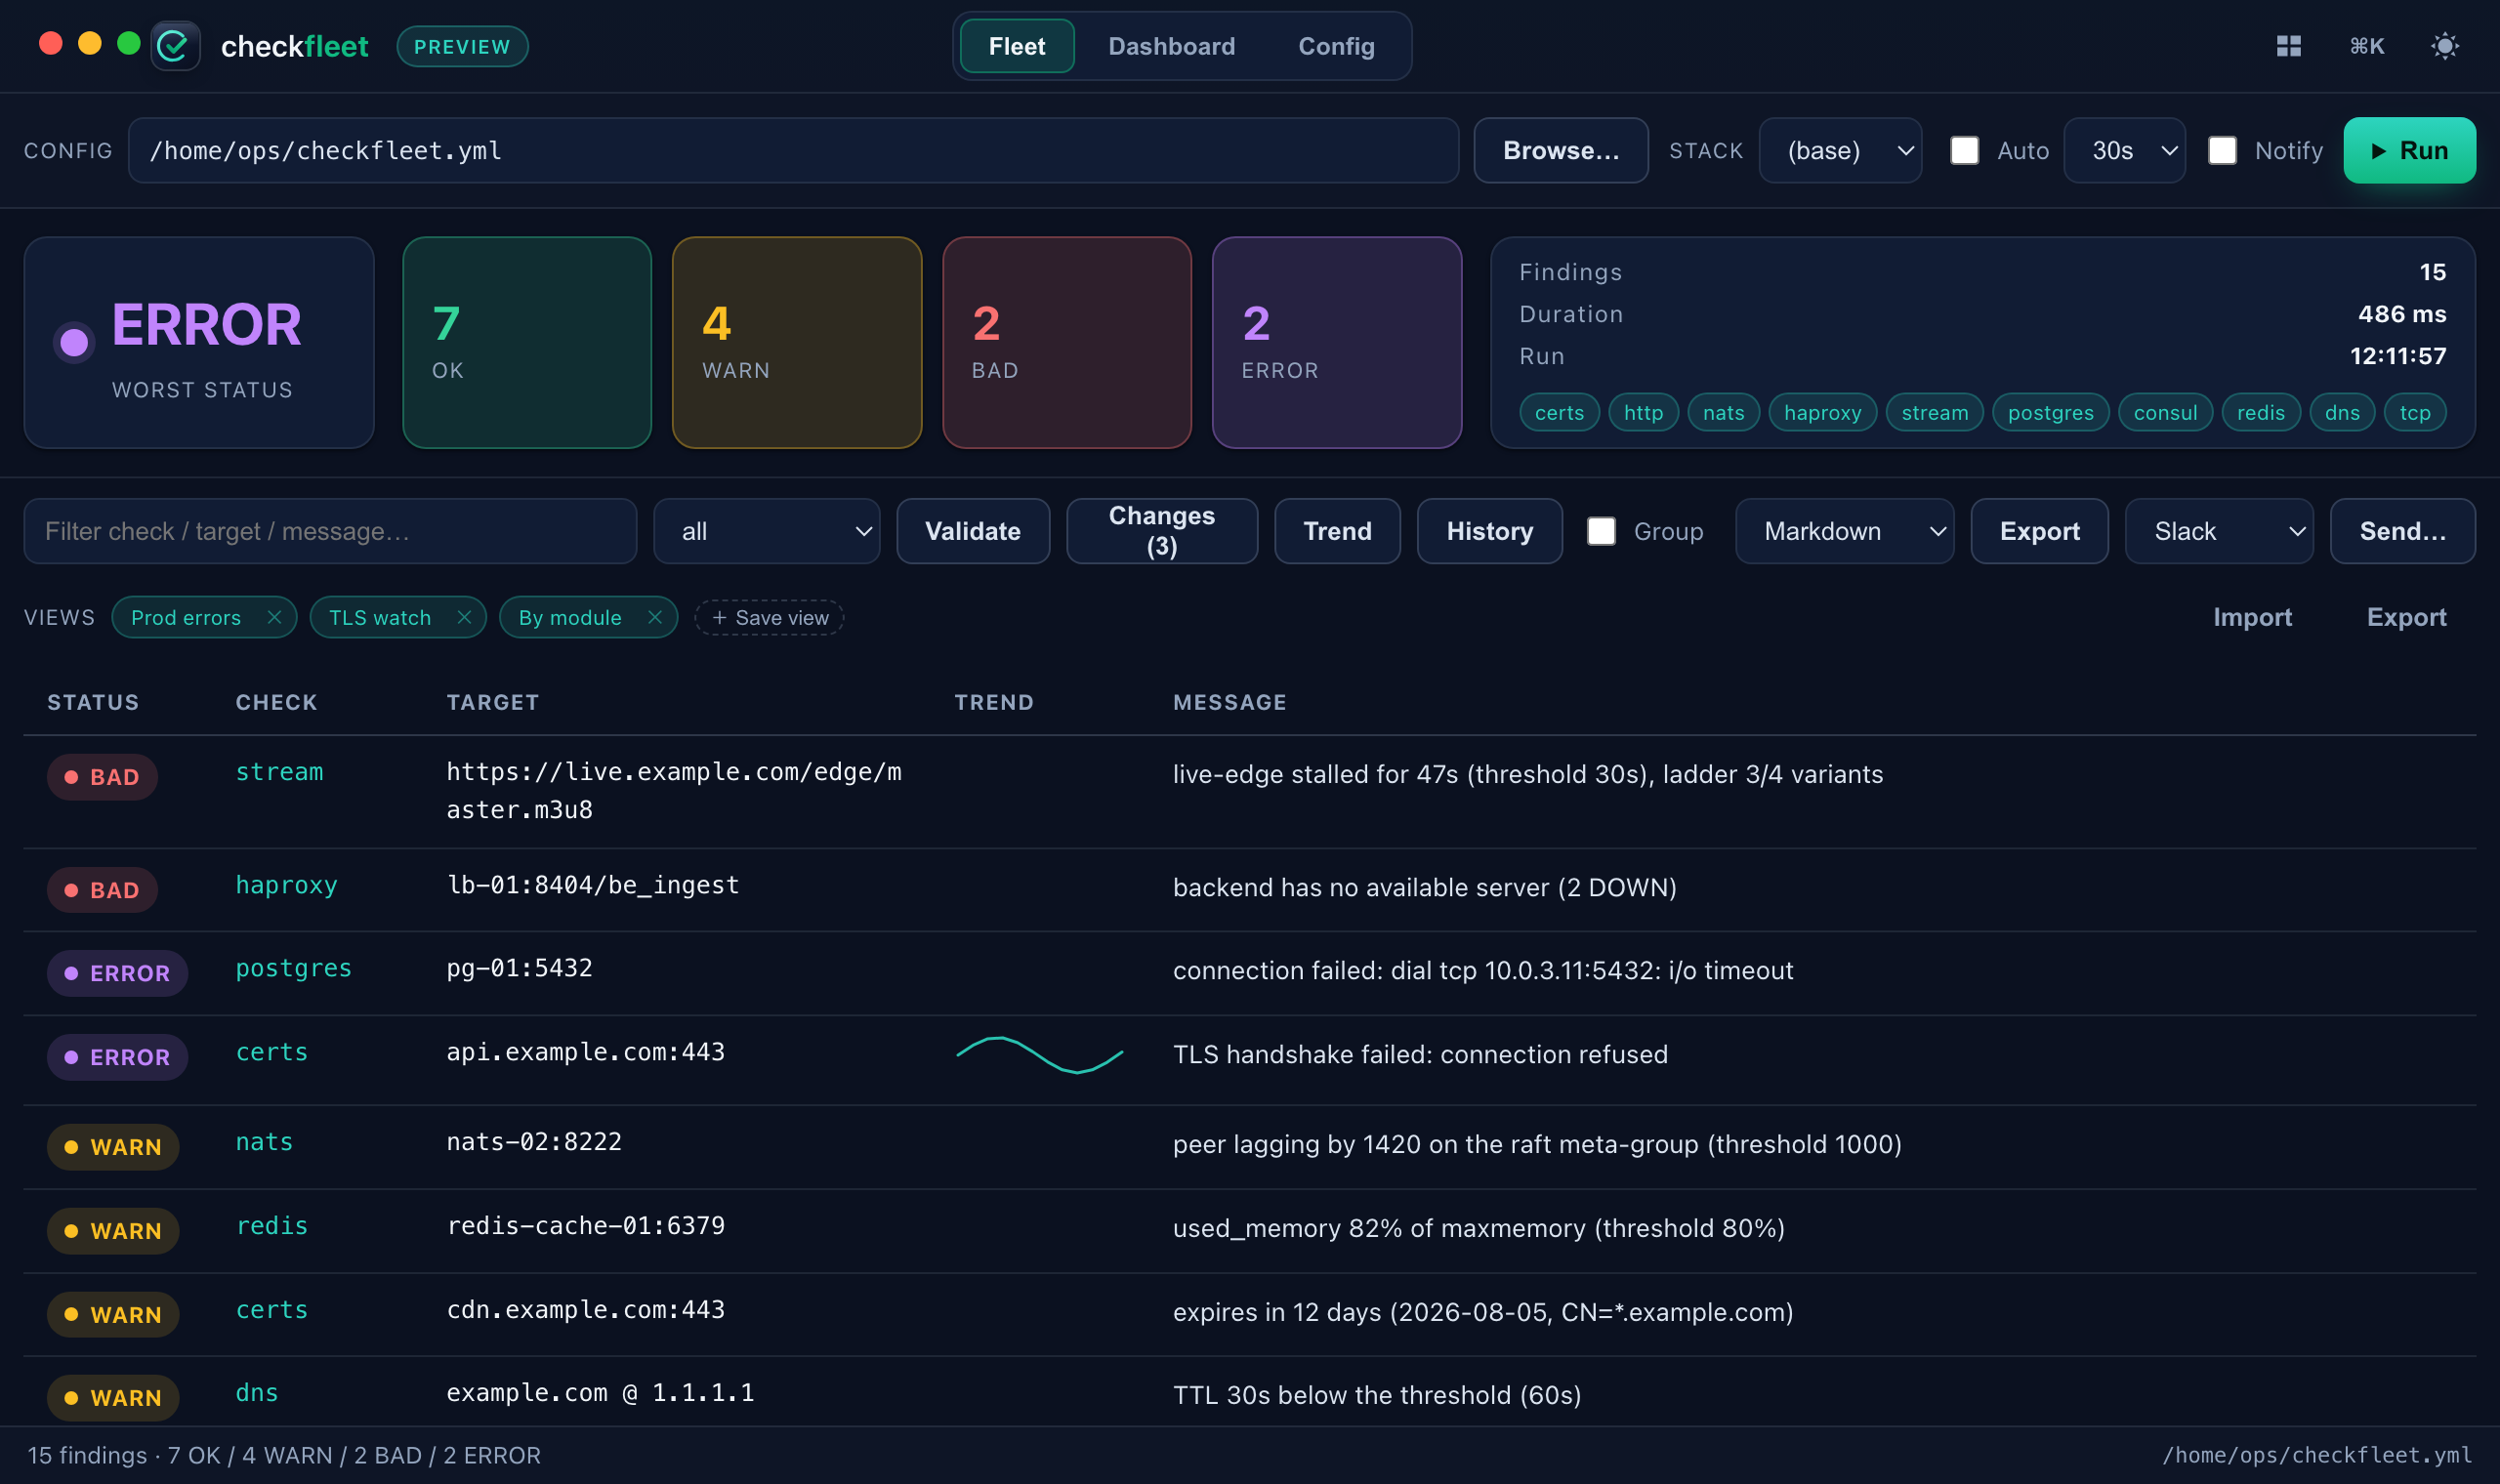
Set the toolbar the way you want it, then + Save view and name it (reusing a name overwrites it). Each chip applies its view on click; the chip lights up when the toolbar already matches it, so you can see at a glance which lens you’re in. The ✕ on a chip deletes it. Saved views are also commands in the palette (⌘K → View: …, plus Save current view).
Import / Export move the whole set as JSON: Export copies it to the clipboard, Import reads a pasted export (matching names are overwritten) — handy for sharing a team’s standard lenses or seeding a new machine. A view is pure UI state (knobs, not data): it holds no credentials and no config contents, and lives in local browser storage, so it never touches your YAML.
Background monitoring
Tick Auto and the app keeps watching the fleet on the chosen interval. The loop runs in Go, not a browser timer, so each pass is a real run of the same modules — findings, trend and history all keep filling in while you’re on another view. A small ● monitoring chip in the status bar shows it’s live, colored by the latest worst status.
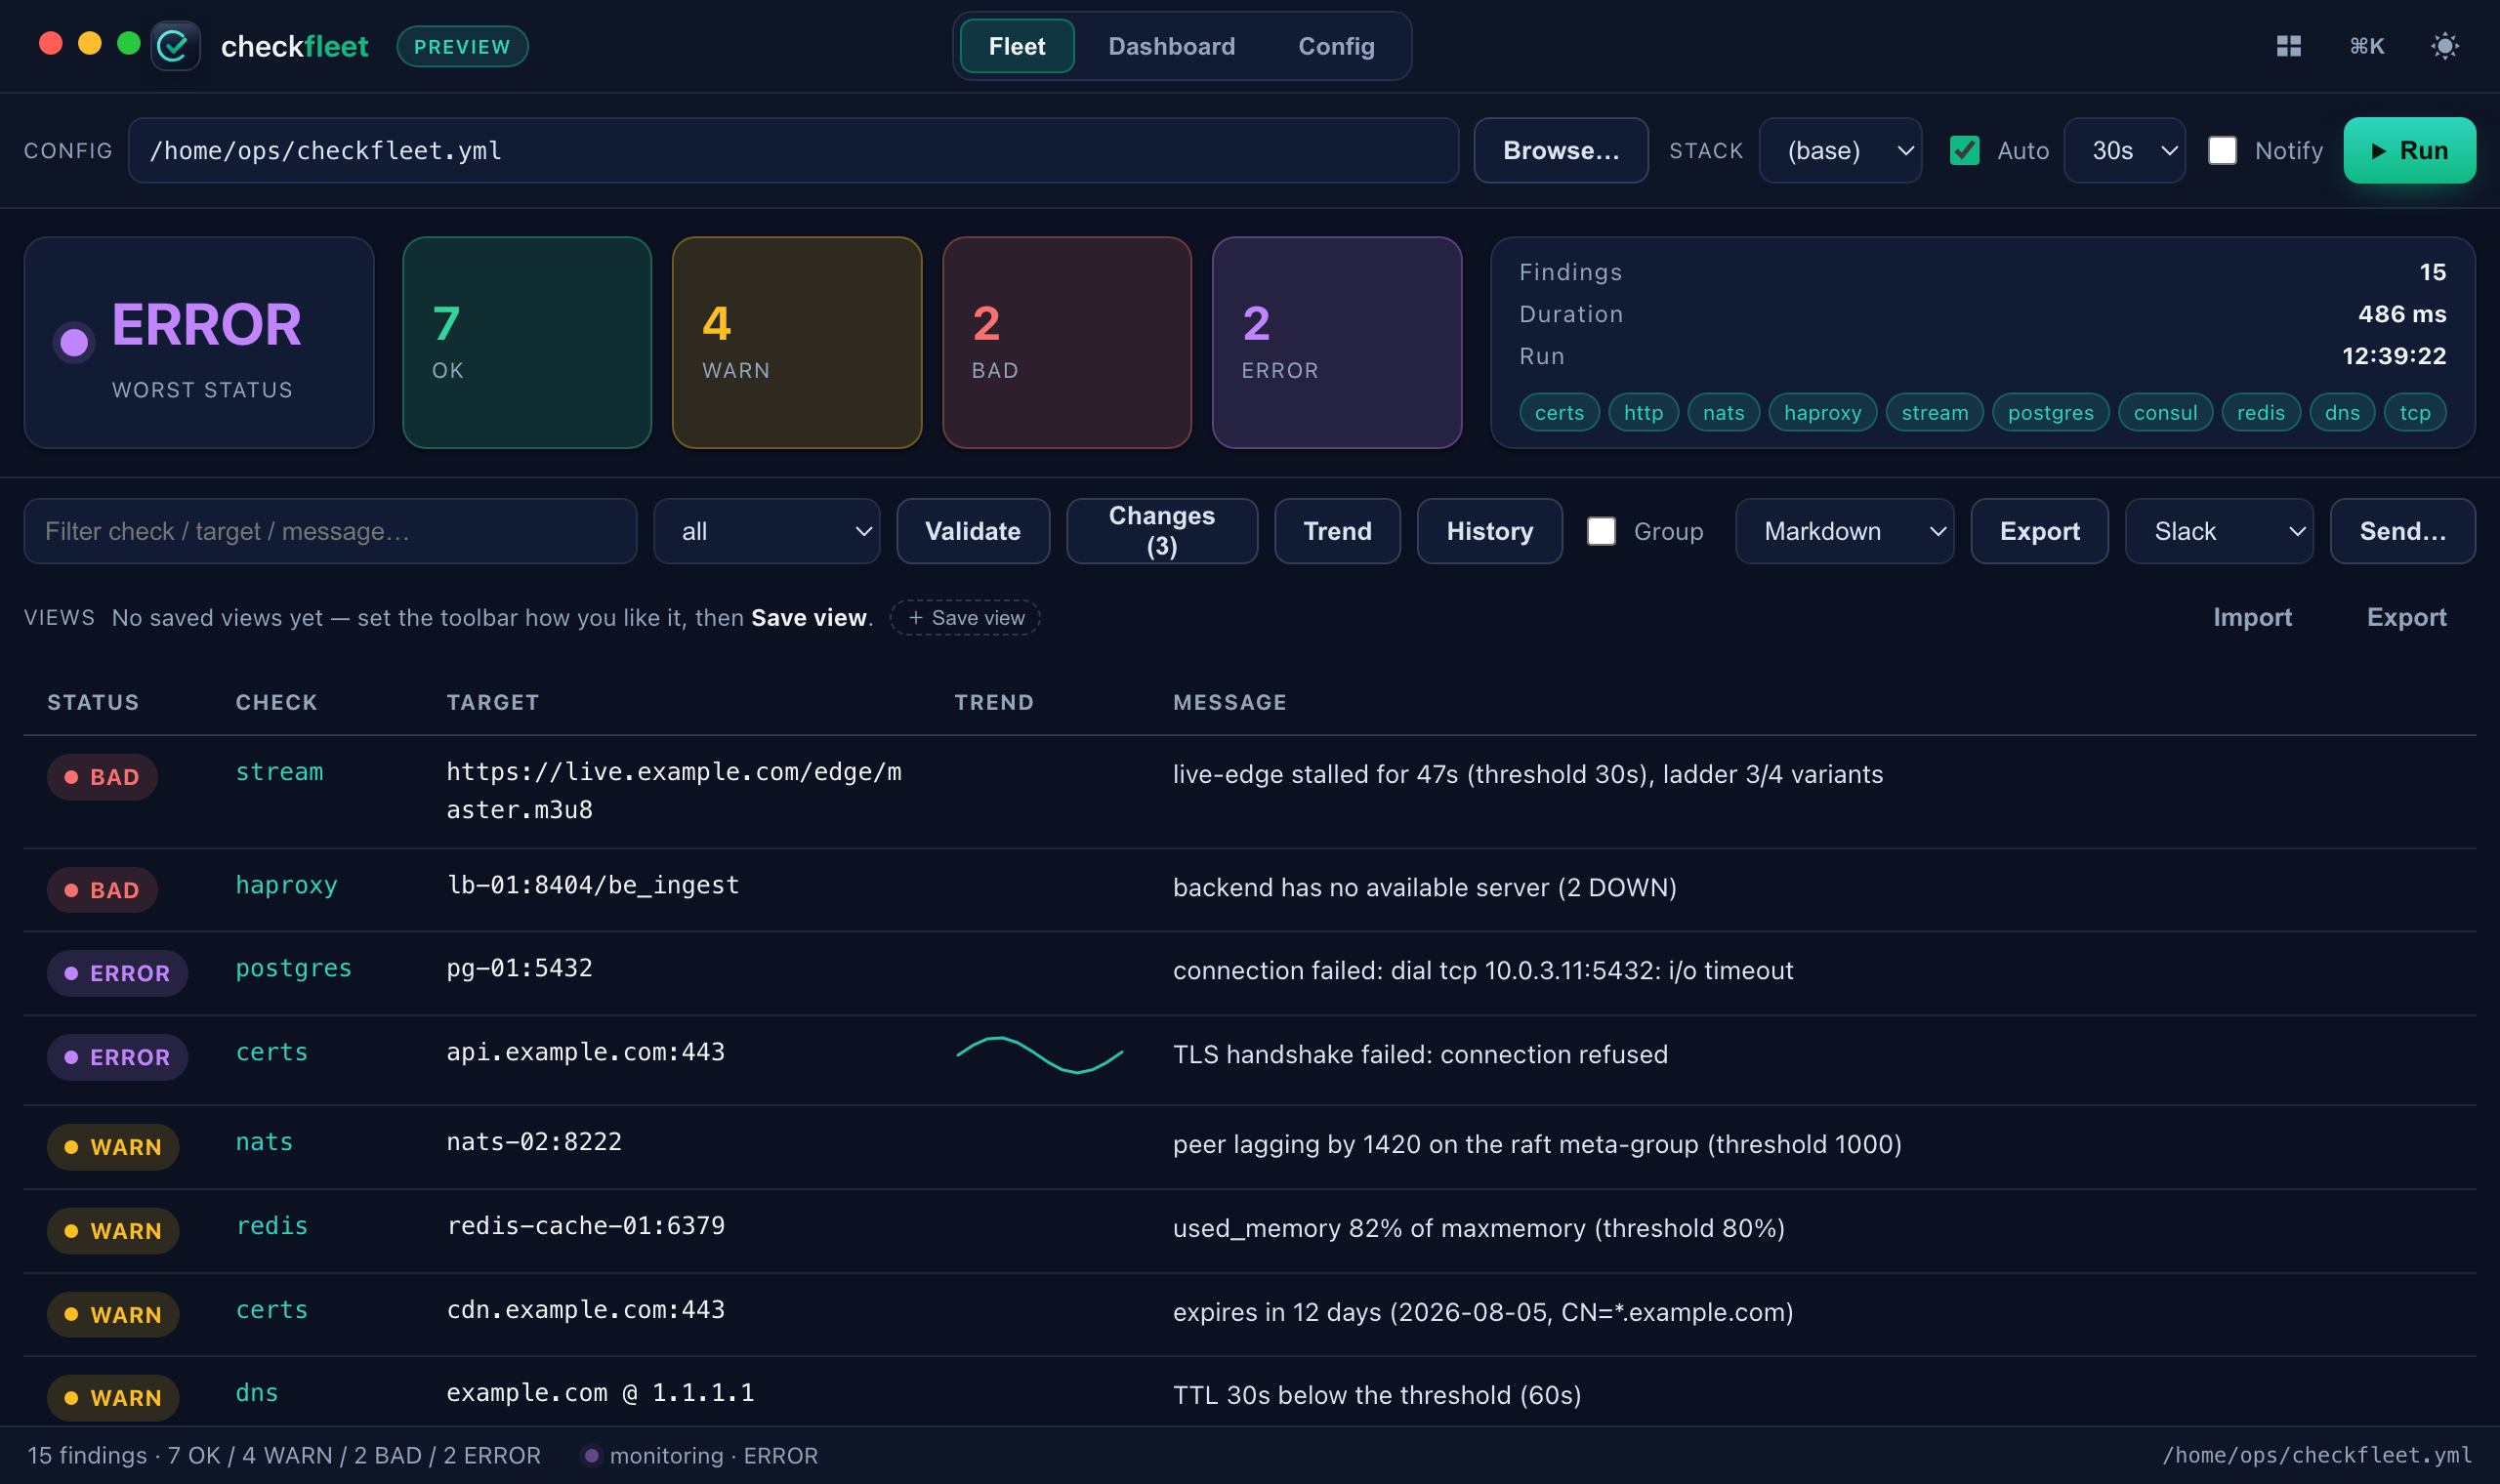
The point of a monitor is to tell you when something changes, not to nag: a native OS notification fires only when the worst status crosses a boundary — degraded (e.g. WARN → ERROR), improved, or recovered to OK. A fleet that stays BAD for an hour notifies once, not sixty times. The crossing is computed over un-muted findings (mutes are pushed to the monitor), so a problem you’ve snoozed won’t wake you. Starting the monitor on an already-broken fleet tells you straight away; starting it on a healthy one is silent until something breaks. Changing the config, stack or interval re-points the monitor automatically.
A colored menu-bar / tray icon is the natural next step here; it needs a system-tray integration that Wails v2 doesn’t provide (it arrives in Wails v3), so it’s deliberately deferred rather than pulled in as a fragile dependency — tracked in the backlog.
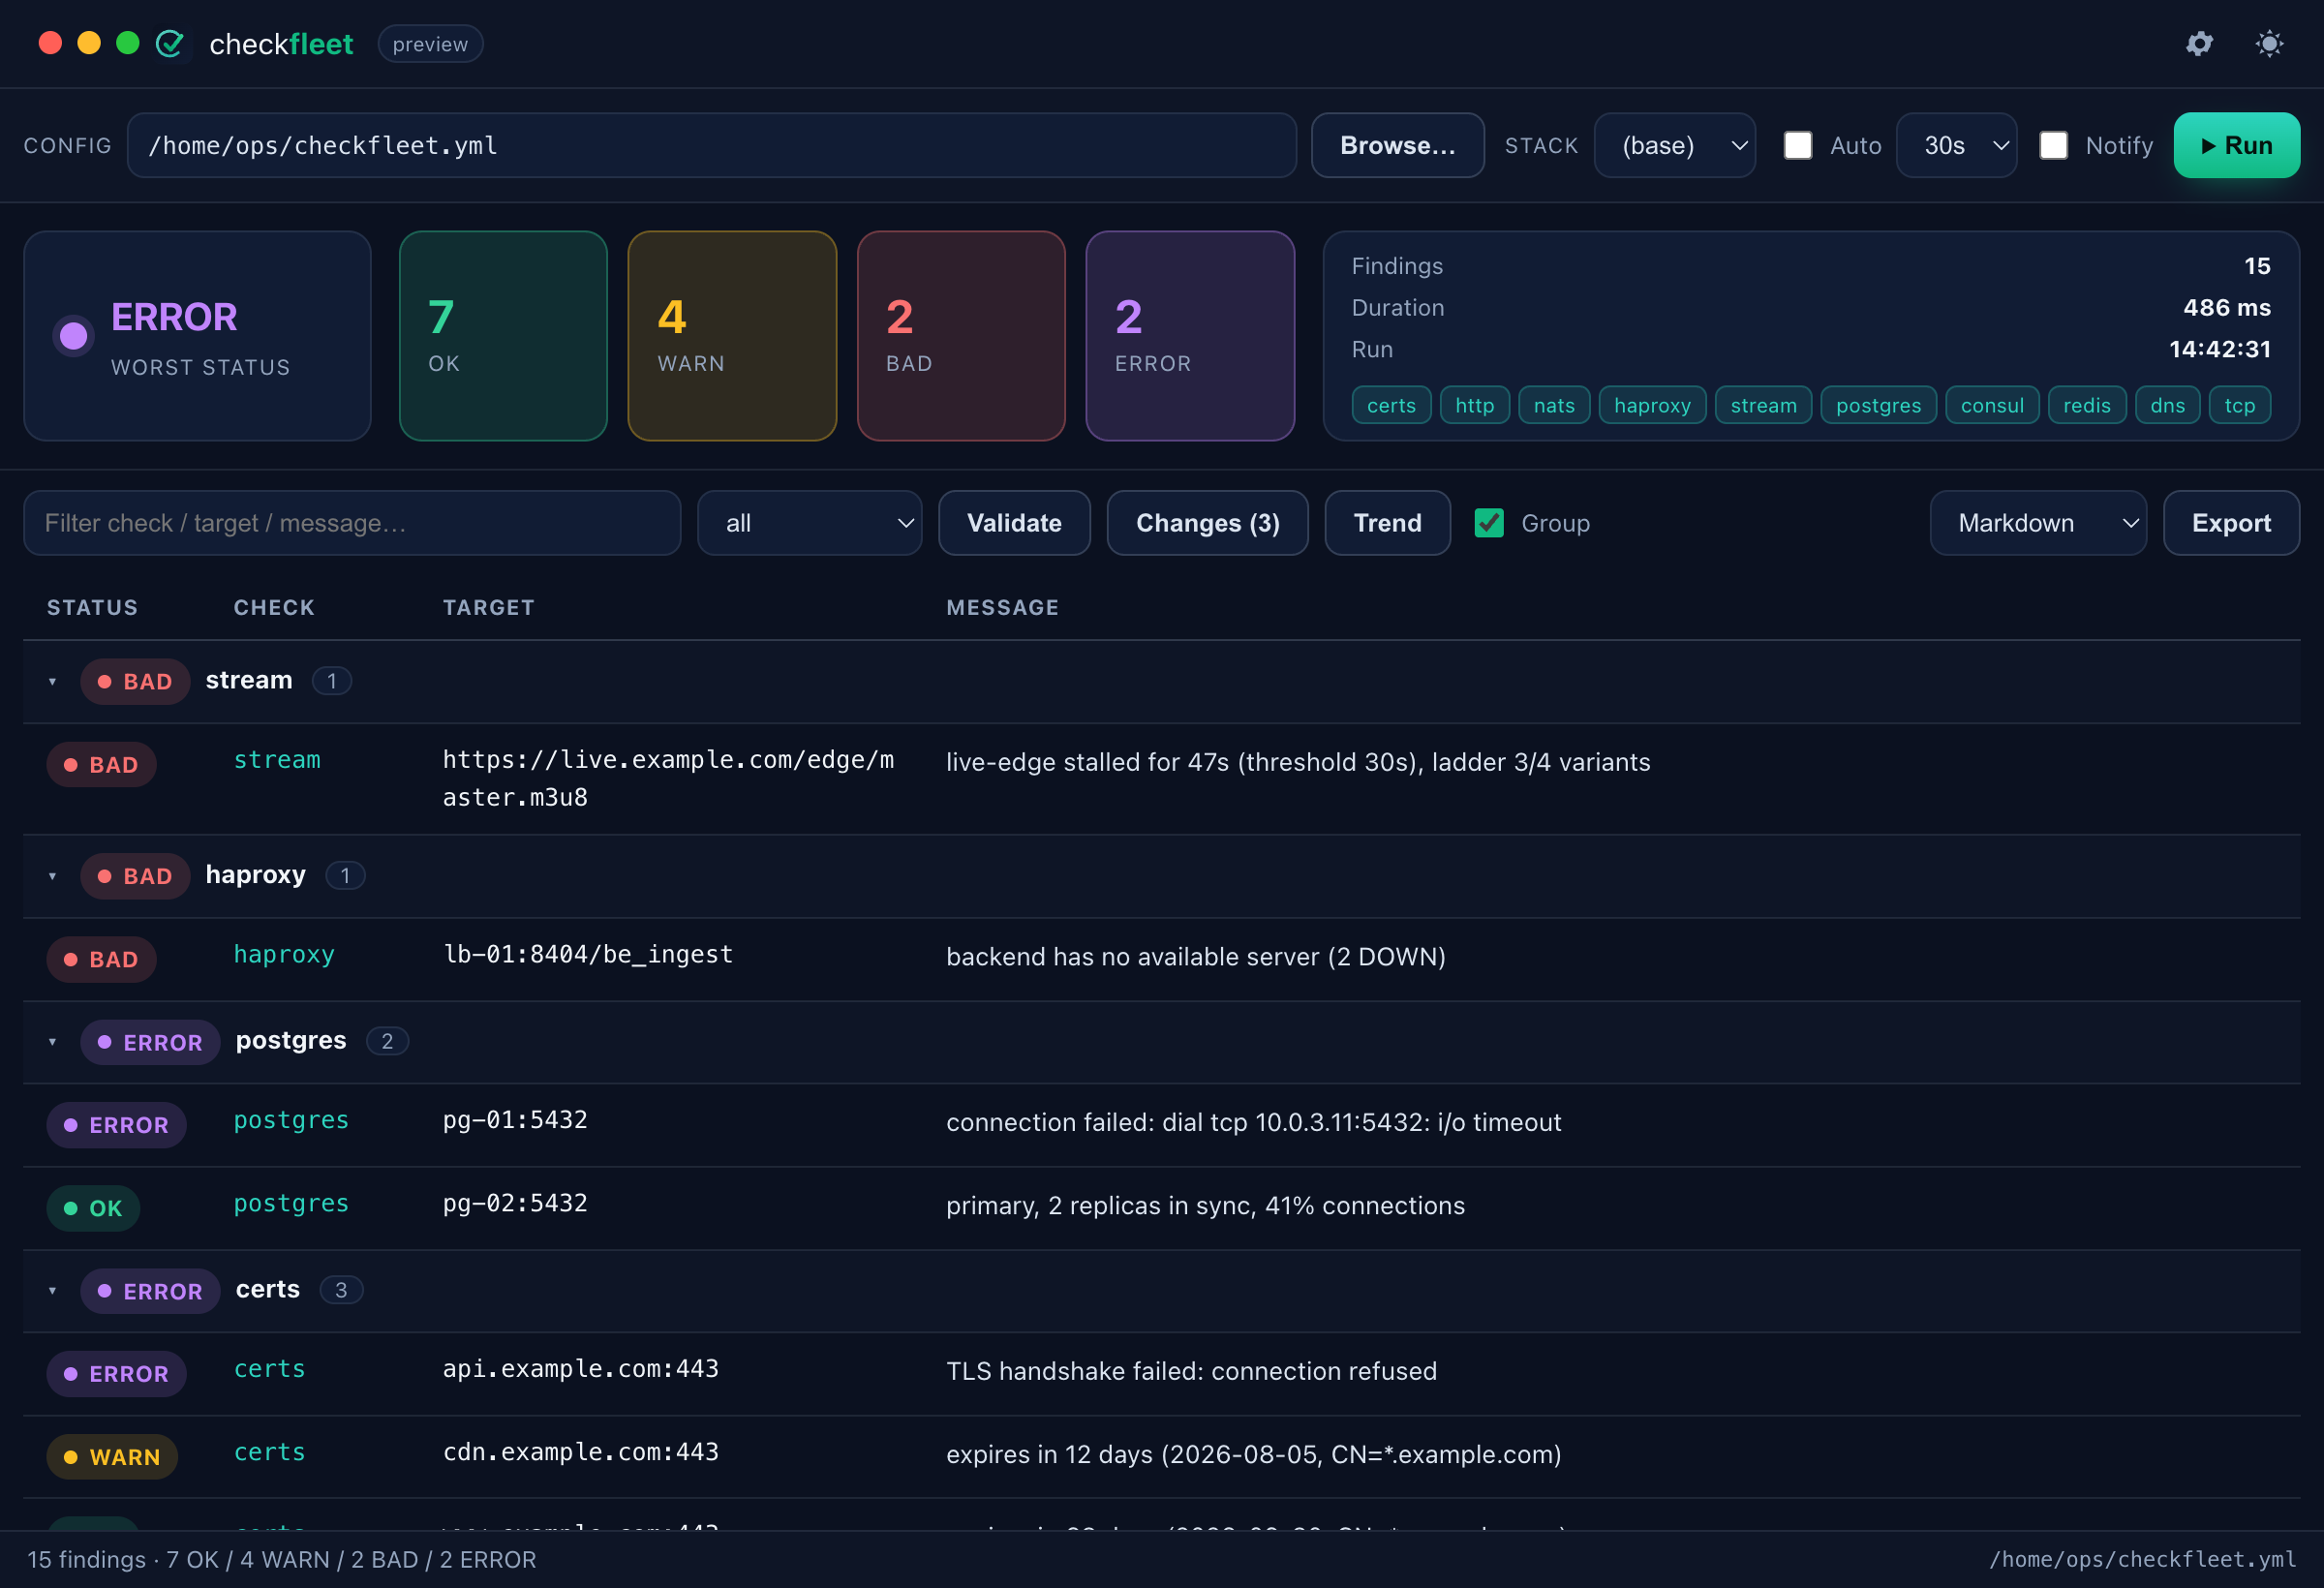
Group by module
Tick Group to fold the findings table into collapsible sections, one per module, each with a rollup badge showing the module’s worst status and how many findings it has. Click a section header to collapse it — handy when a fleet has many targets and you want to scan module-by-module. The choice is remembered between restarts.
Edit the config
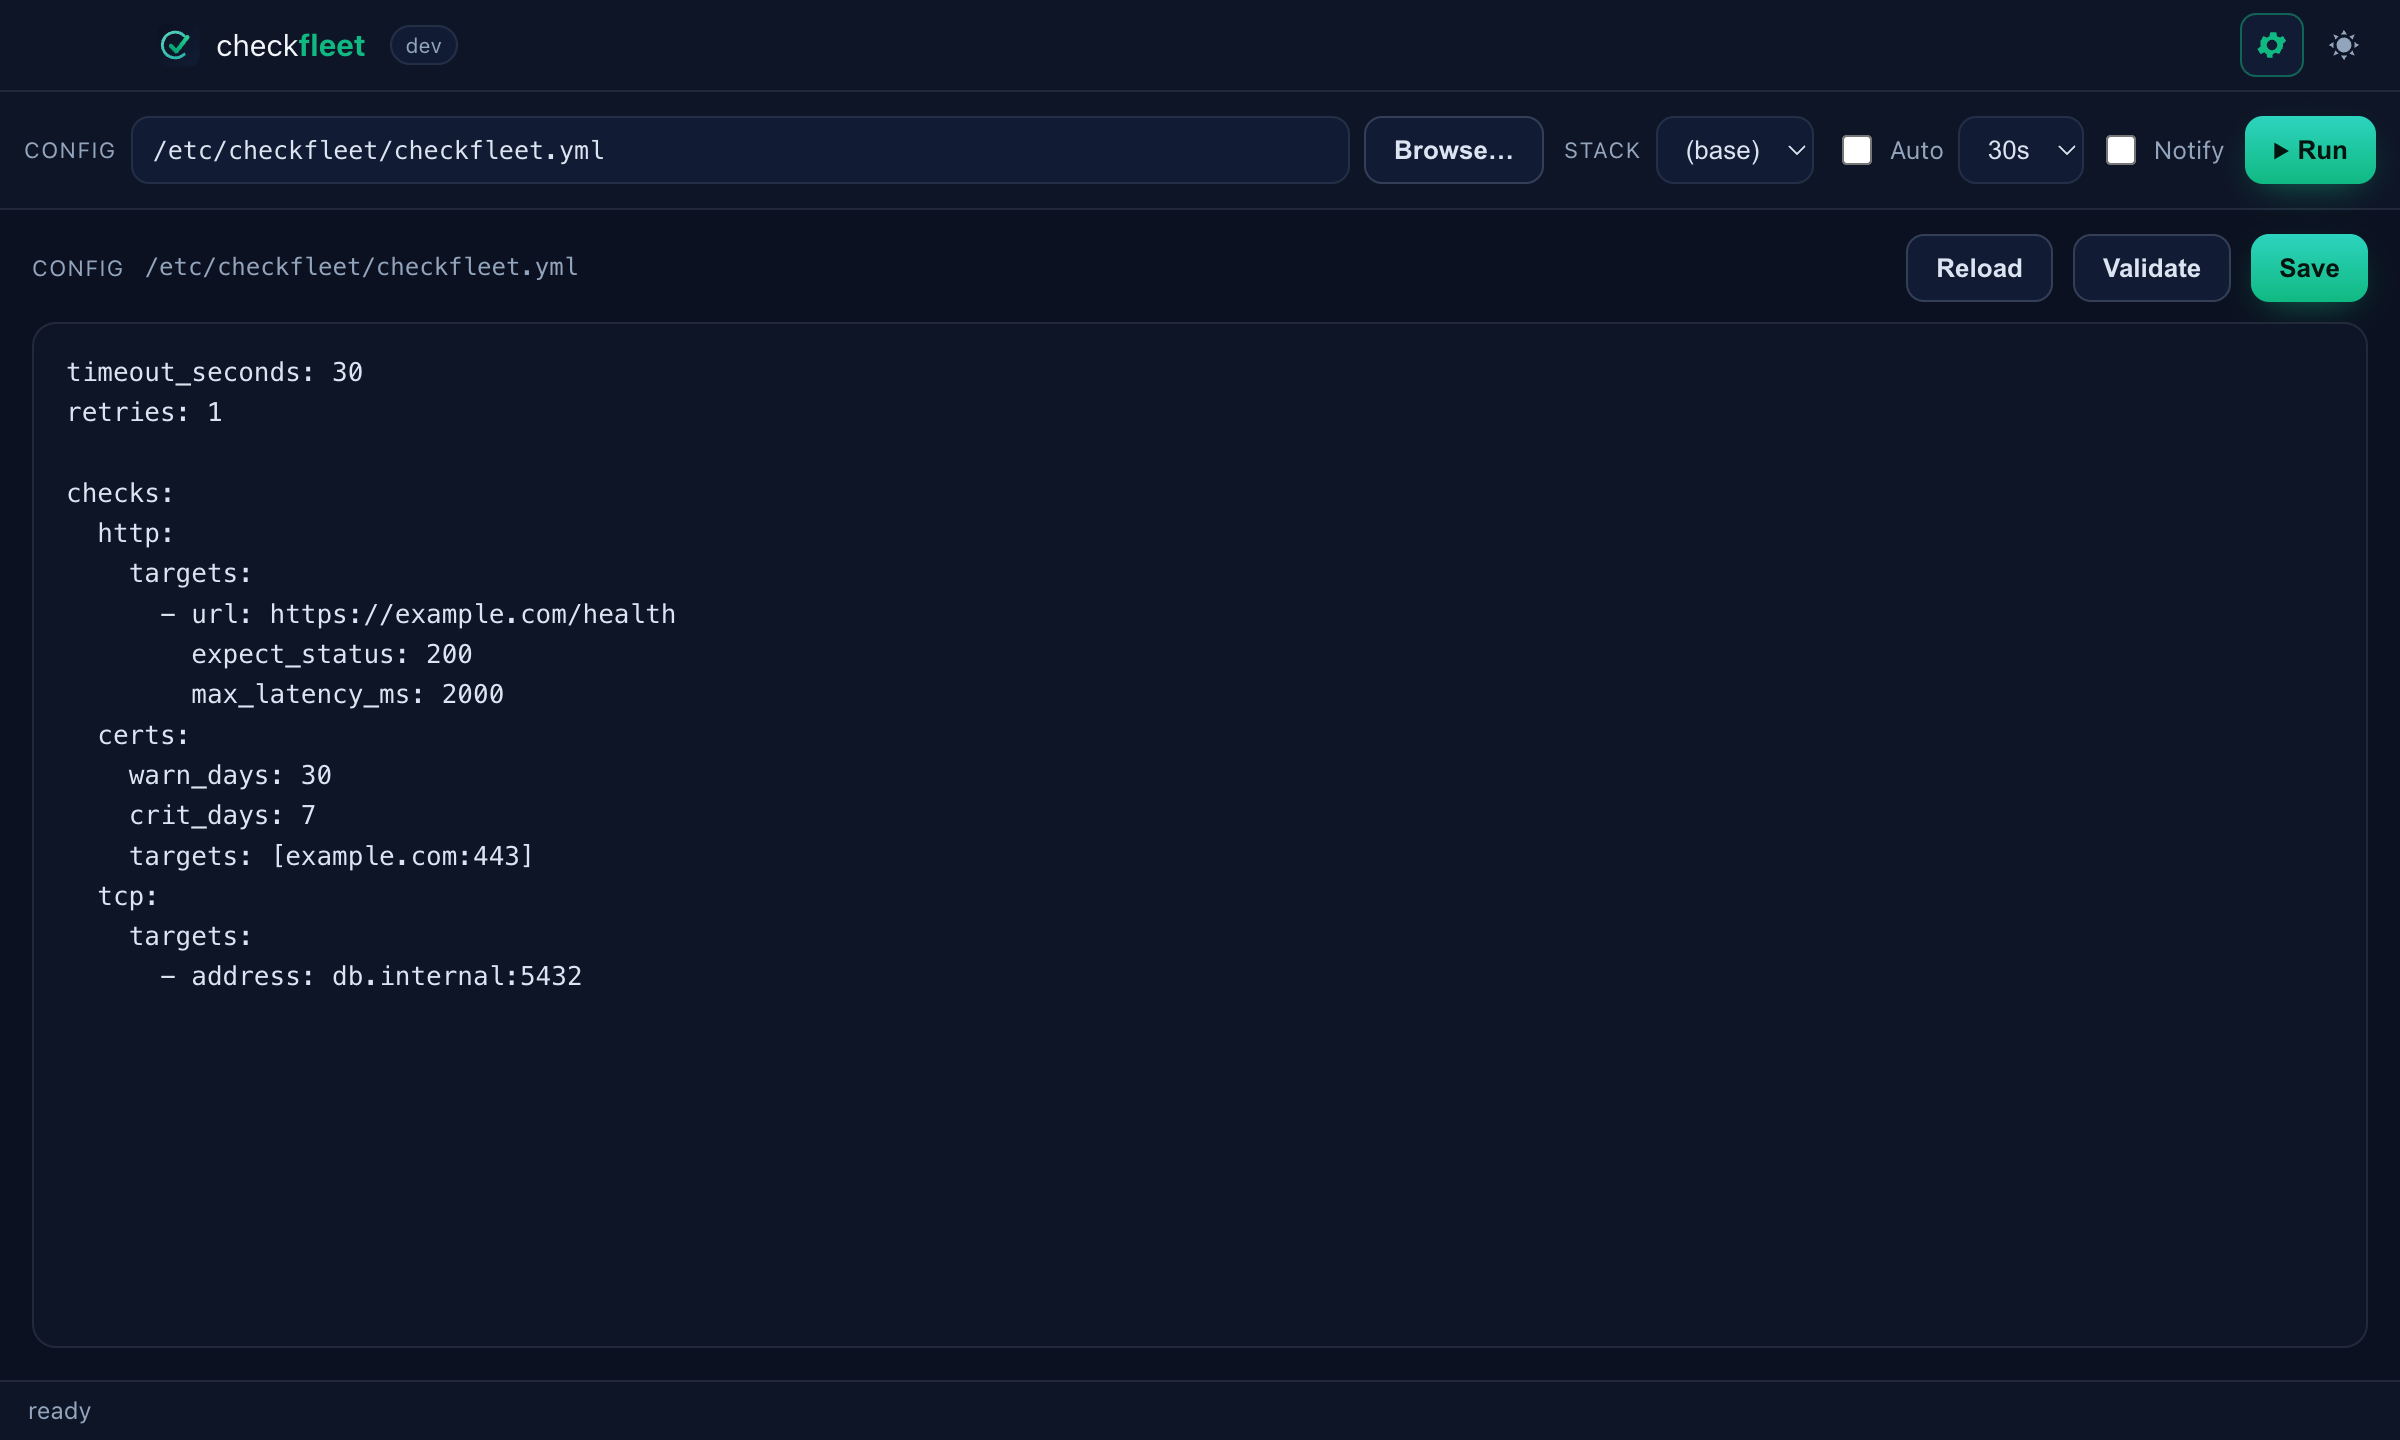
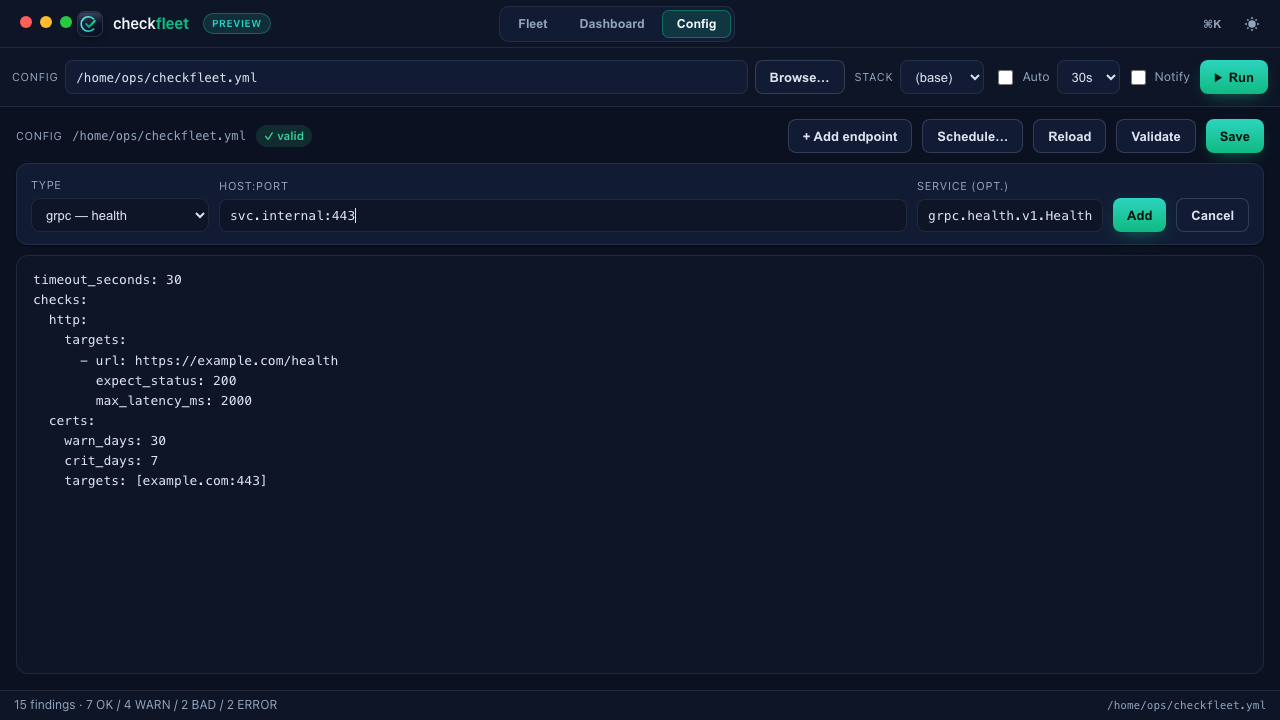
The Config tab (titlebar) opens a full-panel YAML editor on the selected
checkfleet.yml:
- Reload — re-read the file from disk, discarding unsaved edits.
- Validate — check the unsaved text (YAML parse + domain rules) and list any problems inline, without saving. This runs the same validation as the CLI.
- Save — write the text back to the file.
Once saved, run the fleet from the GUI, or point cron / checkfleet serve
--interval at the same file — the config is the single source, and the app is
just one way to edit and run it.
Add an endpoint
You don’t have to hand-write YAML. + Add endpoint opens a quick form for the
common checks — http (URL + expected status), certs / tls
(host:443), tcp / smtp (host:port), dns (name + record type),
redis / nats (host:port), grpc (host:port + optional service) and
postgres (DSN + optional password-env var). Pick a type, fill the field(s)
and Add: the endpoint is merged into the YAML (existing comments and
formatting are preserved), ready to review and Save. Secrets are never
entered here — for postgres you give the name of the env var that holds the
password, not the password itself.
As you type in the editor, a live validity badge next to the path shows
✓ valid or ✕ N problems (hover for the details) — the same checks as the
Validate button, run against the unsaved text, so you catch a broken edit
immediately.
Run it on a schedule
Schedule… prints copy-paste commands to run the same config unattended — a
cron line and a checkfleet serve command for the current file and interval —
so the app and your automation share one source of truth:
# run every 5 min:
*/5 * * * * checkfleet check all --config /etc/checkfleet/checkfleet.yml --exit-on-bad
# or run continuously as a Prometheus exporter:
checkfleet serve --config /etc/checkfleet/checkfleet.yml --interval 5m --listen :9876
Light theme
The theme toggle (top-right) switches light/dark and remembers your choice.
Open straight into a fleet
Two environment variables let the app open on a config and run immediately — handy for an “open with” launcher or a kiosk view:
CHECKFLEET_CONFIG=/etc/checkfleet.yml CHECKFLEET_AUTORUN=1 checkfleet-desktop
Without them the app opens on ./checkfleet.yml (if present) and waits for you
to press Run.
Get it
Every release attaches the desktop builds next to the CLI archives:
checkfleet-desktop_<version>_darwin_universal.zip— macOS.app(Intel + Apple Silicon)checkfleet-desktop_<version>_linux_amd64.tar.gzcheckfleet-desktop_<version>_windows_amd64.zip
The desktop binaries are unsigned for now — on macOS, right-click → Open the first time (or clear the quarantine attribute).
Build from source
Requires the Wails v2 toolchain
and its platform prerequisites (macOS: Xcode command-line tools; Linux:
libgtk-3 + libwebkit2gtk-4.1). Node is not needed — the frontend is static.
cd desktop
go mod tidy
wails dev                                   # hot-reload dev app
wails build -platform darwin/universal      # or linux/amd64, windows/amd64
The app lives in desktop/
as a separate Go module, so the Wails toolchain never enters the CLI’s build.
Insight panels
With a recorded history the app surfaces the same M30 analyses the CLI prints
(checkfleet insight), computed by the shared internal/insight package — no
statistics run in the GUI, so a number means the same thing in both places.
- a Fleet health tile with the index over recent runs beside it;
- correlated failures above the table: click a group to filter the findings down to it (the rows are already below — expanding a copy of them is the wall of text the grouping exists to replace);
- a flapping badge on targets that oscillate, with the score and direction in the tooltip;
- What changed — the narrative digest, with a Copy button because the text is written to be forwarded;
- in a finding’s drawer: recovery (how long it has been down, and how long it usually takes), error budget, baseline deviation and the forecast ETA, each saying why it has nothing to show rather than going blank.
Panels appear only once there is enough history to support them.